| Param | Original file | Final file |
|---|---|---|
| Filename | modeM0/AS1A13_012T08_9000006150cztM0_level2.fits | modeM0/AS1A13_012T08_9000006150cztM0_level2_quad_clean.evt |
| Size (bytes) | 277,176,960 | 302,261,760 |
| Size | 264.3 MB | 288.3 MB |
| Events in quadrant A | 1,622,002 | 1,830,106 |
| Events in quadrant B | 1,498,642 | 1,728,616 |
| Events in quadrant C | 1,643,598 | 1,775,380 |
| Events in quadrant D | 1,416,686 | 1,608,255 |
| Mode M0 | |||
|---|---|---|---|
| Quadrant | BADHDUFLAG | Total packets | Discarded packets |
| A | 0 | 99886 | 0 |
| B | 0 | 119021 | 0 |
| C | 0 | 67483 | 0 |
| D | 0 | 73395 | 0 |
| Mode M9 | |||
|---|---|---|---|
| Quadrant | BADHDUFLAG | Total packets | Discarded packets |
| A | 0 | 17 | 0 |
| B | 0 | 17 | 0 |
| C | 0 | 17 | 0 |
| D | 0 | 17 | 0 |
| Mode SS | |||
|---|---|---|---|
| Quadrant | BADHDUFLAG | Total packets | Discarded packets |
| A | 0 | 650 | 0 |
| B | 0 | 650 | 0 |
| C | 0 | 650 | 0 |
| D | 0 | 650 | 0 |
| Quadrant | Total seconds | Saturated seconds | Saturation percentage |
|---|---|---|---|
| A | 32178 | 766 | 2.380508% |
| B | 32178 | 3834 | 11.914973% |
| C | 32178 | 311 | 0.966499% |
| D | 32178 | 591 | 1.836659% |
Noise dominated data is calculated using 1-second bins in cleaned event files. If a bin has >2000 counts, and if more than 50% of those come from <1% of pixels, then it is considered to be noise-dominated and hence unusable.
| Quadrant | # 1 sec bins | Bins with >0 counts | Bins with >2000 counts | High rate bins dominated by noise | Noise dominated (total time) | Noise dominated (detector-on time) | Marked lightcurve |
|---|---|---|---|---|---|---|---|
| A | 33887 | 32174 | 0 | 0 | 0.00% | 0.00% | 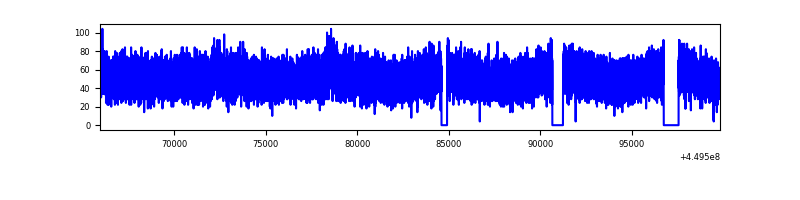 |
| B | 33887 | 32168 | 0 | 0 | 0.00% | 0.00% |  |
| C | 33888 | 32176 | 0 | 0 | 0.00% | 0.00% |  |
| D | 33887 | 32169 | 0 | 0 | 0.00% | 0.00% |  |
Top three noisy pixels from each quadrant. If the there are fewer than three noisy pixels in the level2.evt file, extra rows are filled as -1
| Pixel properties | Quadrant properties | ||||||
|---|---|---|---|---|---|---|---|
| Quadrant | DetID | PixID | Counts | Sigma | Mean | Median | Sigma |
| A | 7 | 110 | 1339 | 8.45 | 422 | 393 | 111.9 |
| A | 15 | 236 | 1323 | 8.31 | 422 | 393 | 111.9 |
| A | 0 | 29 | 1212 | 7.32 | 422 | 393 | 111.9 |
| B | 2 | 9 | 1388 | 12.55 | 394 | 375 | 80.7 |
| B | 2 | 8 | 1130 | 9.36 | 394 | 375 | 80.7 |
| B | 3 | 17 | 1068 | 8.59 | 394 | 375 | 80.7 |
| C | 3 | 202 | 1256 | 7.46 | 434 | 402 | 114.5 |
| C | 1 | 81 | 1227 | 7.21 | 434 | 402 | 114.5 |
| C | 3 | 203 | 1219 | 7.14 | 434 | 402 | 114.5 |
| D | 4 | 250 | 1069 | 6.12 | 406 | 367 | 114.7 |
| D | 3 | 31 | 1031 | 5.79 | 406 | 367 | 114.7 |
| D | 8 | 176 | 1027 | 5.75 | 406 | 367 | 114.7 |
Histogram calculated using DETX and DETY for each event in the final _common_clean file
| Quadrant A |  |
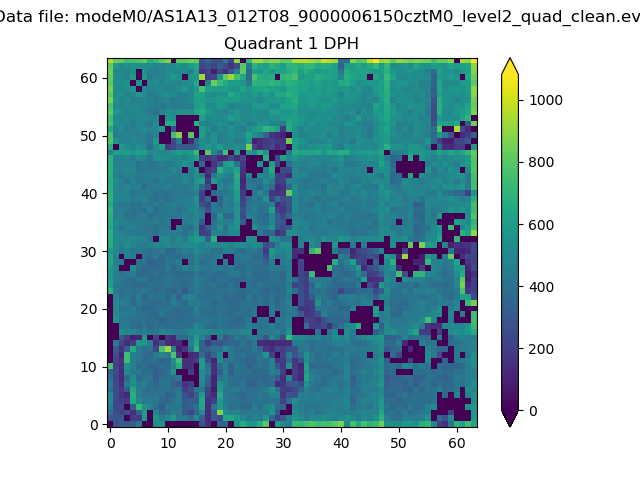 |
Quadrant B |
|---|---|---|---|
| Quadrant D |  |
 |
Quadrant C |
| Plot type | Count rate plots | Images |
|---|---|---|
| Comparison with Poisson distribution Blue bars denote a histogram of data divided into 1 sec bins. Red curve is a Poisson curve with rate = median count rate of data. |
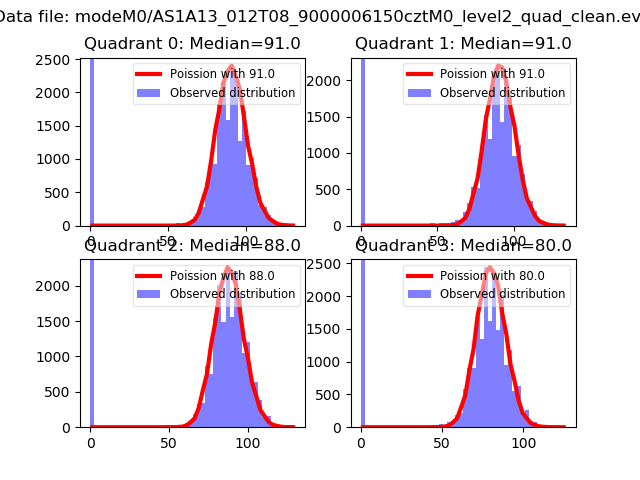 |
 |
| Quadrant-wise count rates Data is divided into 100 sec bins |
 |
|
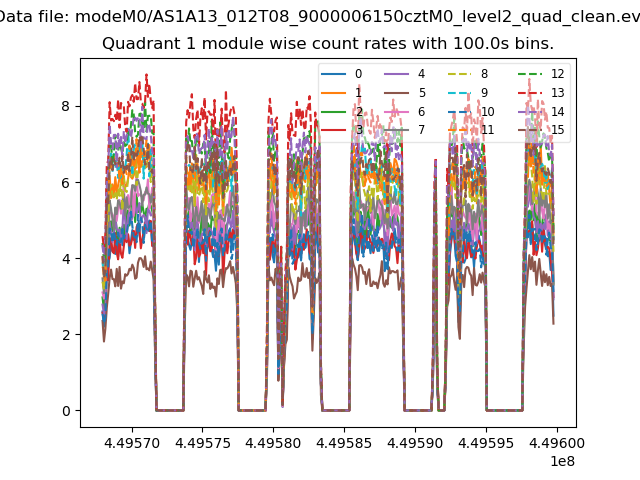
| Module-wise count rates for Quadrant A Data is divided into 100 sec bins |
 |
 |
| Module-wise count rates for Quadrant B Data is divided into 100 sec bins |
 |
 |
| Module-wise count rates for Quadrant C Data is divided into 100 sec bins |
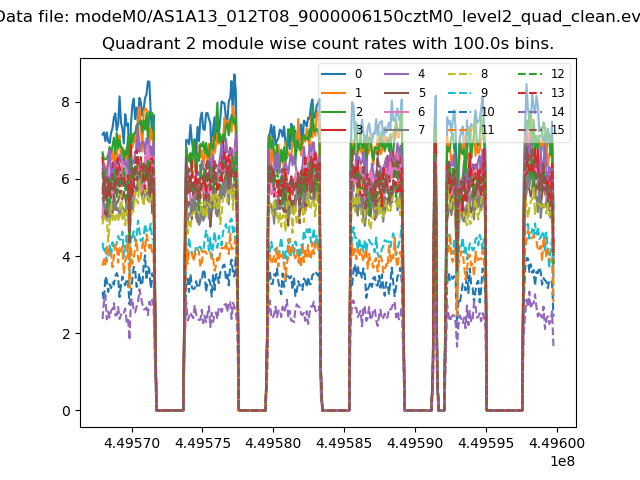 |
 |
| Module-wise count rates for Quadrant D Data is divided into 100 sec bins |
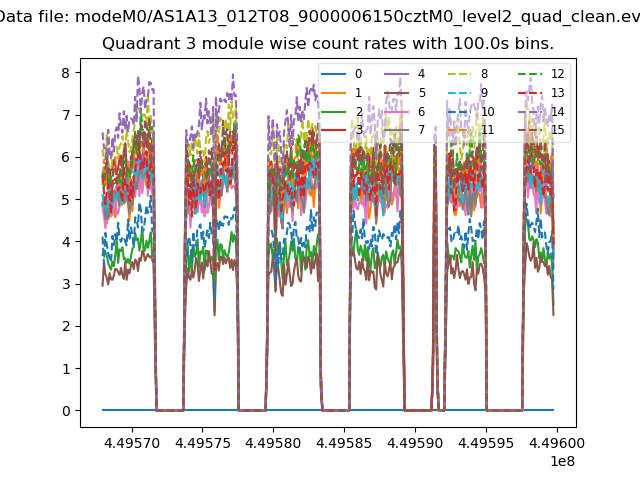 |
 |
| Parameter | Plot |
|---|---|
| CZT HV Monitor |  |
| D_VDD |  |
| Temperature 1 |  |
| Veto HV Monitor |  |
| Veto LLD | 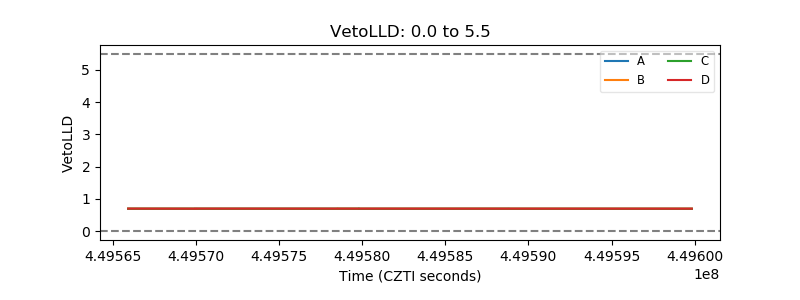 |
| Alpha Counter |  |
| _CPM_Rate |  |
| CZT Counter |  |
| +2.5 Volts monitor | 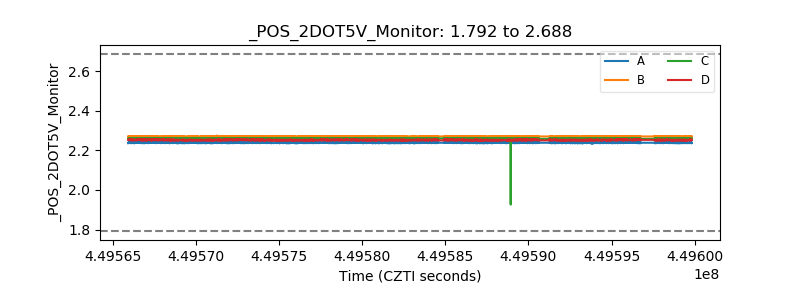 |
| +5 Volts monitor |  |
| _ROLL_ROT |  |
| _Roll_DEC | 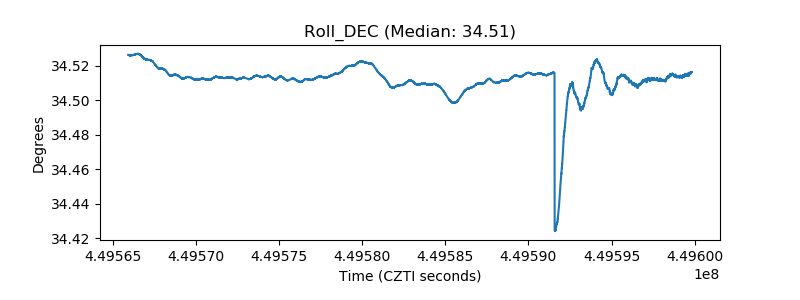 |
| _Roll_RA | 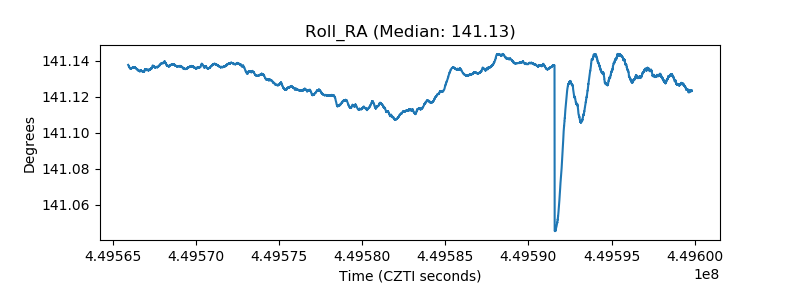 |
| Veto Counter |  |