| Param | Original file | Final file |
|---|---|---|
| Filename | modeM0/AS1A13_017T01_9000006148cztM0_level2.fits | modeM0/AS1A13_017T01_9000006148cztM0_level2_quad_clean.evt |
| Size (bytes) | 1,256,662,080 | 1,288,728,000 |
| Size | 1.2 GB | 1.2 GB |
| Events in quadrant A | 7,270,482 | 7,420,707 |
| Events in quadrant B | 6,933,766 | 7,247,874 |
| Events in quadrant C | 7,606,784 | 7,723,059 |
| Events in quadrant D | 6,386,550 | 6,793,523 |
| Mode SS | |||
|---|---|---|---|
| Quadrant | BADHDUFLAG | Total packets | Discarded packets |
| A | 0 | 2914 | 0 |
| B | 0 | 2914 | 0 |
| C | 0 | 2914 | 0 |
| D | 0 | 2914 | 0 |
| Mode M0 | |||
|---|---|---|---|
| Quadrant | BADHDUFLAG | Total packets | Discarded packets |
| A | 0 | 514041 | 0 |
| B | 0 | 532755 | 0 |
| C | 0 | 307837 | 0 |
| D | 0 | 398416 | 0 |
| Mode M9 | |||
|---|---|---|---|
| Quadrant | BADHDUFLAG | Total packets | Discarded packets |
| A | 0 | 188 | 0 |
| B | 0 | 188 | 0 |
| C | 0 | 189 | 0 |
| D | 0 | 189 | 0 |
| Quadrant | Total seconds | Saturated seconds | Saturation percentage |
|---|---|---|---|
| A | 143665 | 9865 | 6.866669% |
| B | 143665 | 19926 | 13.869766% |
| C | 143666 | 2305 | 1.604416% |
| D | 143665 | 6982 | 4.859917% |
Noise dominated data is calculated using 1-second bins in cleaned event files. If a bin has >2000 counts, and if more than 50% of those come from <1% of pixels, then it is considered to be noise-dominated and hence unusable.
| Quadrant | # 1 sec bins | Bins with >0 counts | Bins with >2000 counts | High rate bins dominated by noise | Noise dominated (total time) | Noise dominated (detector-on time) | Marked lightcurve |
|---|---|---|---|---|---|---|---|
| A | 206218 | 143331 | 0 | 0 | 0.00% | 0.00% | 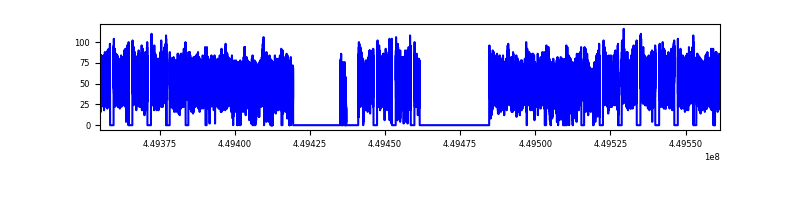 |
| B | 206217 | 143607 | 0 | 0 | 0.00% | 0.00% |  |
| C | 206217 | 143625 | 0 | 0 | 0.00% | 0.00% |  |
| D | 206218 | 143556 | 0 | 0 | 0.00% | 0.00% |  |
Top three noisy pixels from each quadrant. If the there are fewer than three noisy pixels in the level2.evt file, extra rows are filled as -1
| Pixel properties | Quadrant properties | ||||||
|---|---|---|---|---|---|---|---|
| Quadrant | DetID | PixID | Counts | Sigma | Mean | Median | Sigma |
| A | 7 | 110 | 5924 | 8.66 | 1894 | 1766 | 479.9 |
| A | 0 | 29 | 5591 | 7.97 | 1894 | 1766 | 479.9 |
| A | 15 | 236 | 5580 | 7.95 | 1894 | 1766 | 479.9 |
| B | 2 | 9 | 6409 | 12.83 | 1828 | 1734 | 364.5 |
| B | 2 | 8 | 5133 | 9.32 | 1828 | 1734 | 364.5 |
| B | 3 | 17 | 4898 | 8.68 | 1828 | 1734 | 364.5 |
| C | 3 | 202 | 5858 | 7.67 | 2010 | 1873 | 519.3 |
| C | 3 | 203 | 5773 | 7.51 | 2010 | 1873 | 519.3 |
| C | 1 | 81 | 5759 | 7.48 | 2010 | 1873 | 519.3 |
| D | 8 | 176 | 5361 | 7.33 | 1831 | 1664 | 504.6 |
| D | 4 | 250 | 4876 | 6.36 | 1831 | 1664 | 504.6 |
| D | 10 | 189 | 4608 | 5.83 | 1831 | 1664 | 504.6 |
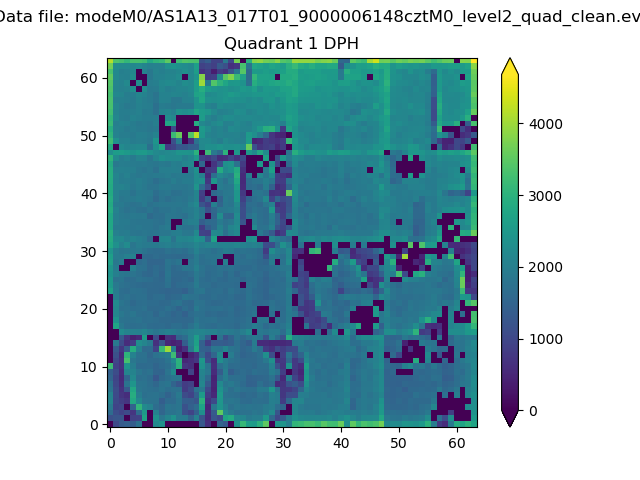
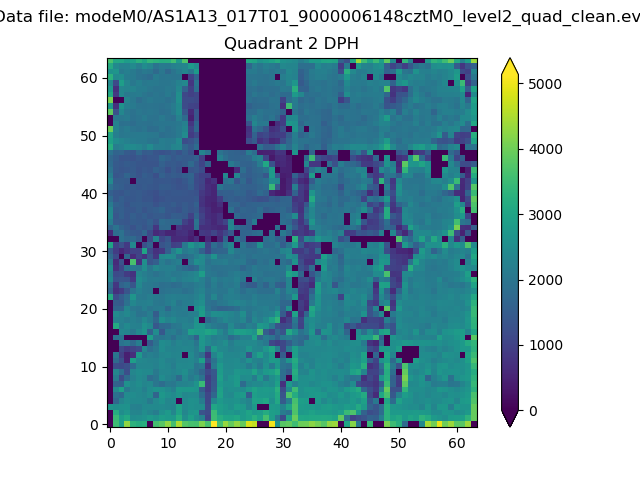
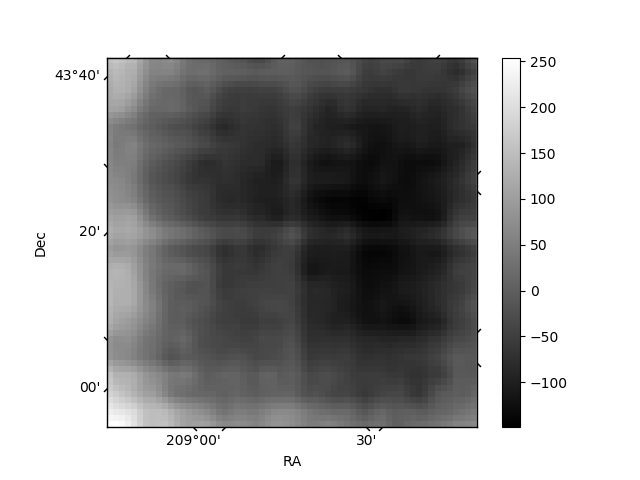
Histogram calculated using DETX and DETY for each event in the final _common_clean file
| Quadrant A |  |
 |
Quadrant B |
|---|---|---|---|
| Quadrant D |  |
 |
Quadrant C |
| Plot type | Count rate plots | Images |
|---|---|---|
| Comparison with Poisson distribution Blue bars denote a histogram of data divided into 1 sec bins. Red curve is a Poisson curve with rate = median count rate of data. |
 |
 |
| Quadrant-wise count rates Data is divided into 100 sec bins |
 |
|
| Module-wise count rates for Quadrant A Data is divided into 100 sec bins |
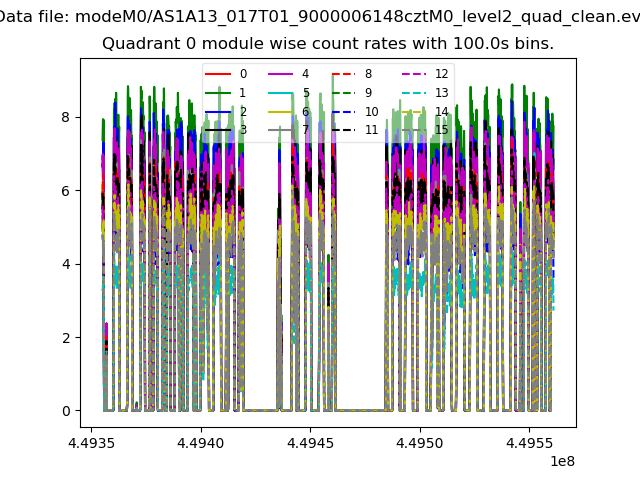 |
 |
| Module-wise count rates for Quadrant B Data is divided into 100 sec bins |
 |
 |
| Module-wise count rates for Quadrant C Data is divided into 100 sec bins |
 |
 |
| Module-wise count rates for Quadrant D Data is divided into 100 sec bins |
 |
 |
| Parameter | Plot |
|---|---|
| CZT HV Monitor |  |
| D_VDD | 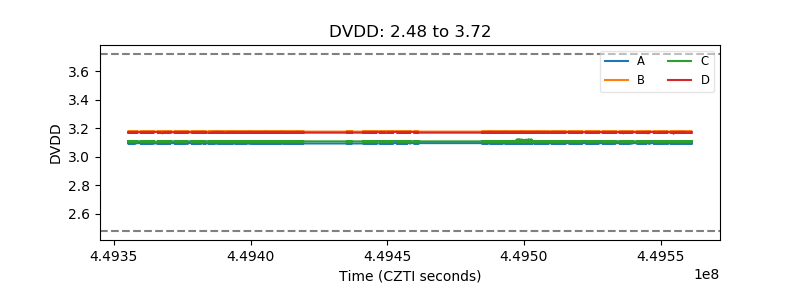 |
| Temperature 1 |  |
| Veto HV Monitor | 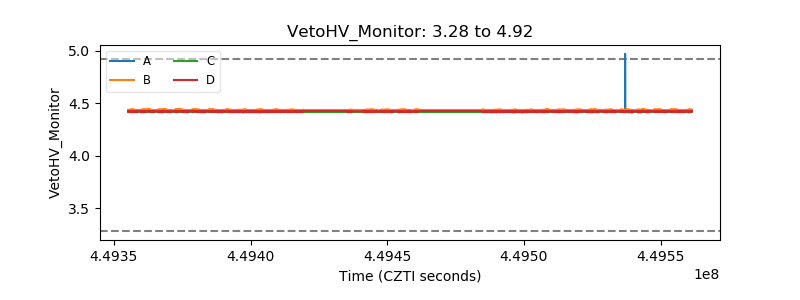 |
| Veto LLD |  |
| Alpha Counter |  |
| _CPM_Rate |  |
| CZT Counter | 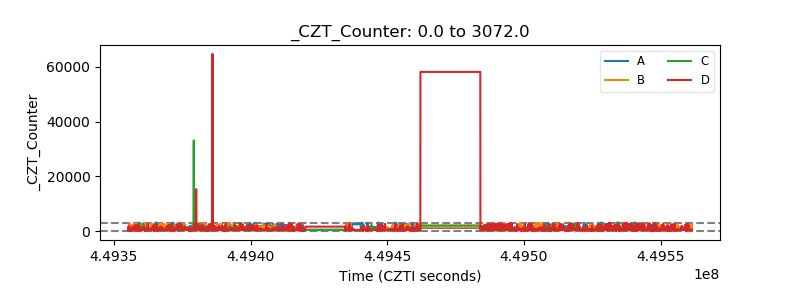 |
| +2.5 Volts monitor |  |
| +5 Volts monitor | 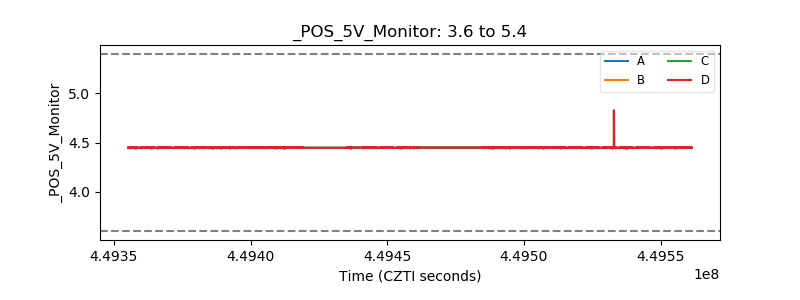 |
| _ROLL_ROT | 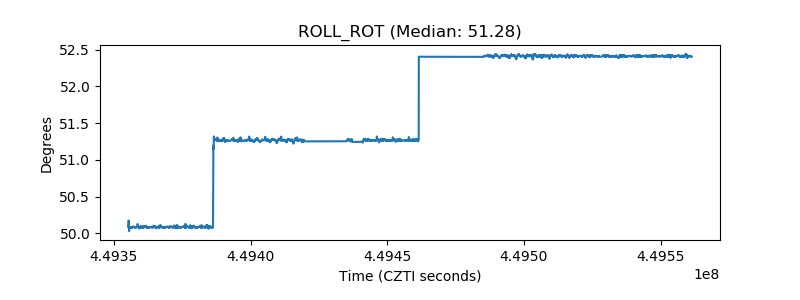 |
| _Roll_DEC | 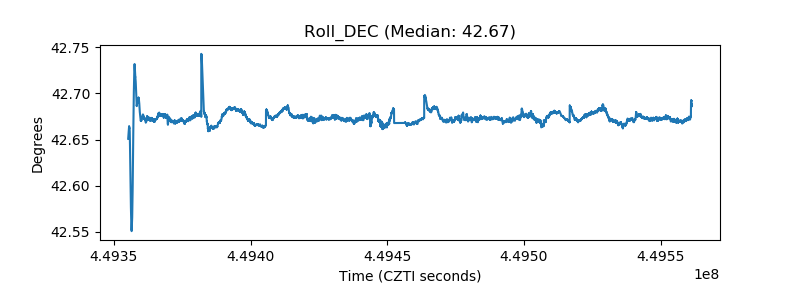 |
| _Roll_RA |  |
| Veto Counter |  |