| Param | Original file | Final file |
|---|---|---|
| Filename | modeM0/AS1A13_071T06_9000006146cztM0_level2.fits | modeM0/AS1A13_071T06_9000006146cztM0_level2_quad_clean.evt |
| Size (bytes) | 815,489,280 | 799,171,200 |
| Size | 777.7 MB | 762.1 MB |
| Events in quadrant A | 4,906,768 | 5,053,361 |
| Events in quadrant B | 4,162,214 | 3,552,308 |
| Events in quadrant C | 4,985,550 | 4,940,918 |
| Events in quadrant D | 4,050,042 | 4,080,076 |
| Mode M0 | |||
|---|---|---|---|
| Quadrant | BADHDUFLAG | Total packets | Discarded packets |
| A | 0 | 310845 | 0 |
| B | 0 | 486214 | 0 |
| C | 0 | 202108 | 0 |
| D | 0 | 341678 | 0 |
| Mode SS | |||
|---|---|---|---|
| Quadrant | BADHDUFLAG | Total packets | Discarded packets |
| A | 0 | 1950 | 0 |
| B | 0 | 1948 | 0 |
| C | 0 | 1950 | 0 |
| D | 0 | 1946 | 0 |
| Mode M9 | |||
|---|---|---|---|
| Quadrant | BADHDUFLAG | Total packets | Discarded packets |
| A | 0 | 126 | 0 |
| B | 0 | 125 | 0 |
| C | 0 | 126 | 0 |
| D | 0 | 126 | 0 |
| Quadrant | Total seconds | Saturated seconds | Saturation percentage |
|---|---|---|---|
| A | 95872 | 2882 | 3.006091% |
| B | 95874 | 30130 | 31.426664% |
| C | 95922 | 912 | 0.950773% |
| D | 95894 | 8472 | 8.834755% |
Noise dominated data is calculated using 1-second bins in cleaned event files. If a bin has >2000 counts, and if more than 50% of those come from <1% of pixels, then it is considered to be noise-dominated and hence unusable.
| Quadrant | # 1 sec bins | Bins with >0 counts | Bins with >2000 counts | High rate bins dominated by noise | Noise dominated (total time) | Noise dominated (detector-on time) | Marked lightcurve |
|---|---|---|---|---|---|---|---|
| A | 108844 | 95946 | 0 | 0 | 0.00% | 0.00% |  |
| B | 108834 | 95626 | 0 | 0 | 0.00% | 0.00% |  |
| C | 108915 | 96010 | 0 | 0 | 0.00% | 0.00% |  |
| D | 108886 | 95946 | 0 | 0 | 0.00% | 0.00% |  |
Top three noisy pixels from each quadrant. If the there are fewer than three noisy pixels in the level2.evt file, extra rows are filled as -1
| Pixel properties | Quadrant properties | ||||||
|---|---|---|---|---|---|---|---|
| Quadrant | DetID | PixID | Counts | Sigma | Mean | Median | Sigma |
| A | 7 | 110 | 3972 | 8.46 | 1277 | 1194 | 328.3 |
| A | 15 | 236 | 3939 | 8.36 | 1277 | 1194 | 328.3 |
| A | 0 | 29 | 3868 | 8.14 | 1277 | 1194 | 328.3 |
| B | 2 | 9 | 3794 | 12.52 | 1099 | 1044 | 219.7 |
| B | 2 | 8 | 3103 | 9.37 | 1099 | 1044 | 219.7 |
| B | 3 | 17 | 2909 | 8.49 | 1099 | 1044 | 219.7 |
| C | 1 | 81 | 3840 | 7.66 | 1318 | 1224 | 341.6 |
| C | 1 | 80 | 3814 | 7.58 | 1318 | 1224 | 341.6 |
| C | 3 | 202 | 3812 | 7.58 | 1318 | 1224 | 341.6 |
| D | 4 | 16 | 2995 | 5.96 | 1165 | 1054 | 325.9 |
| D | 10 | 189 | 2963 | 5.86 | 1165 | 1054 | 325.9 |
| D | 6 | 38 | 2925 | 5.74 | 1165 | 1054 | 325.9 |
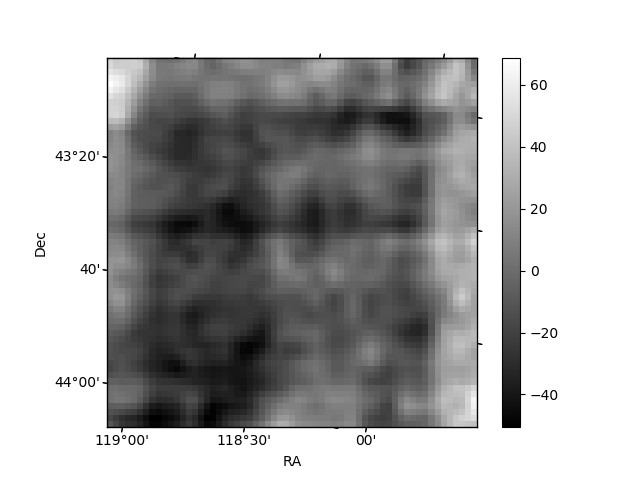
Histogram calculated using DETX and DETY for each event in the final _common_clean file
| Quadrant A |  |
 |
Quadrant B |
|---|---|---|---|
| Quadrant D |  |
 |
Quadrant C |
| Plot type | Count rate plots | Images |
|---|---|---|
| Comparison with Poisson distribution Blue bars denote a histogram of data divided into 1 sec bins. Red curve is a Poisson curve with rate = median count rate of data. |
 |
 |
| Quadrant-wise count rates Data is divided into 100 sec bins |
 |
|
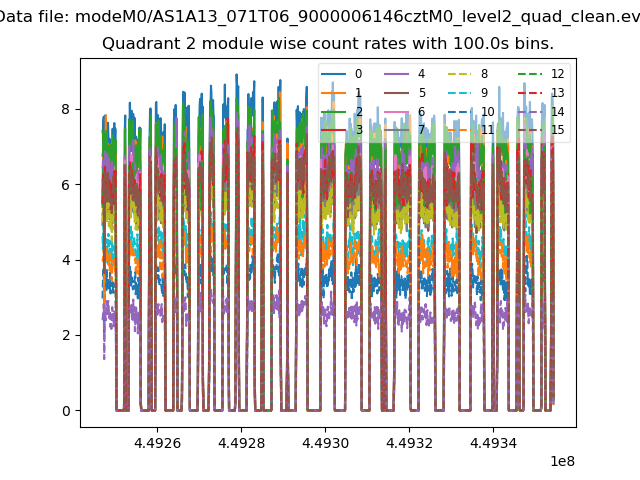
| Module-wise count rates for Quadrant A Data is divided into 100 sec bins |
 |
 |
| Module-wise count rates for Quadrant B Data is divided into 100 sec bins |
 |
 |
| Module-wise count rates for Quadrant C Data is divided into 100 sec bins |
 |
 |
| Module-wise count rates for Quadrant D Data is divided into 100 sec bins |
 |
 |
| Parameter | Plot |
|---|---|
| CZT HV Monitor |  |
| D_VDD | 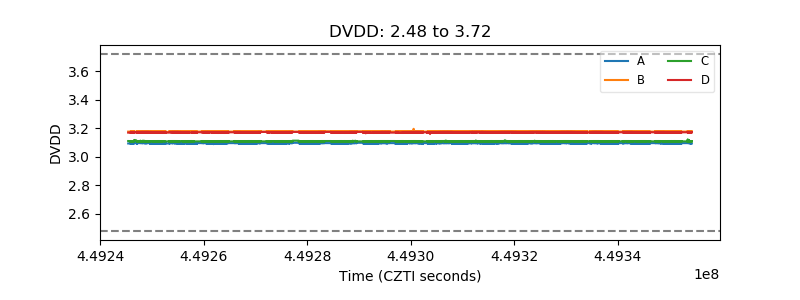 |
| Temperature 1 |  |
| Veto HV Monitor |  |
| Veto LLD |  |
| Alpha Counter |  |
| _CPM_Rate |  |
| CZT Counter | 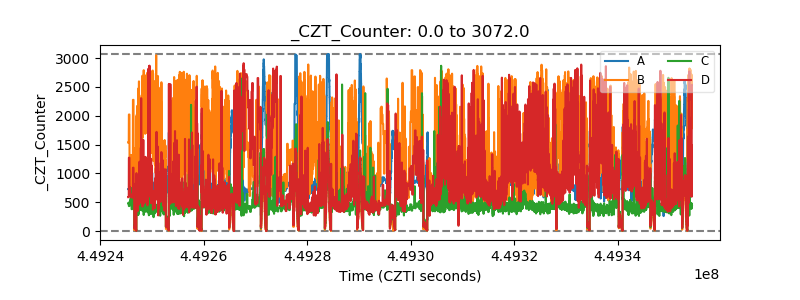 |
| +2.5 Volts monitor | 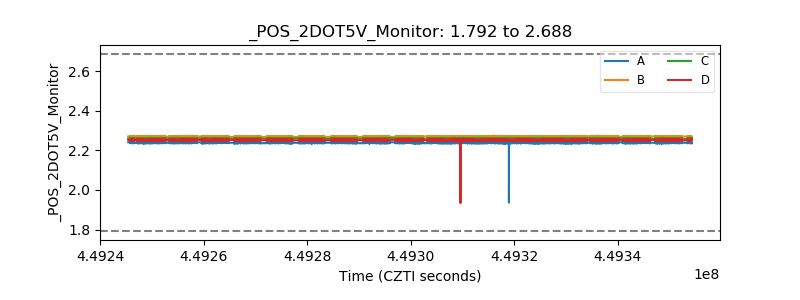 |
| +5 Volts monitor | 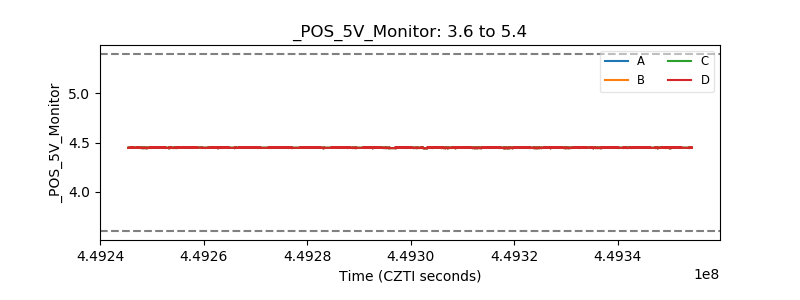 |
| _ROLL_ROT |  |
| _Roll_DEC |  |
| _Roll_RA | 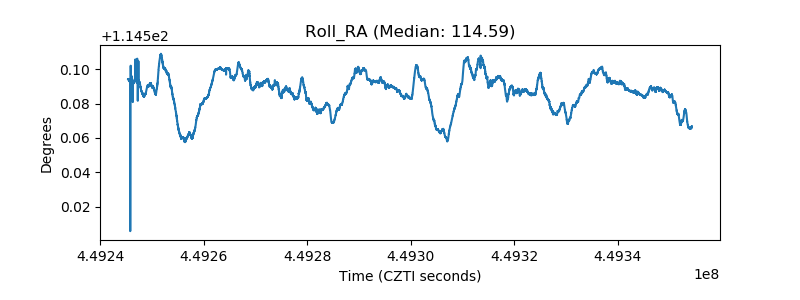 |
| Veto Counter | 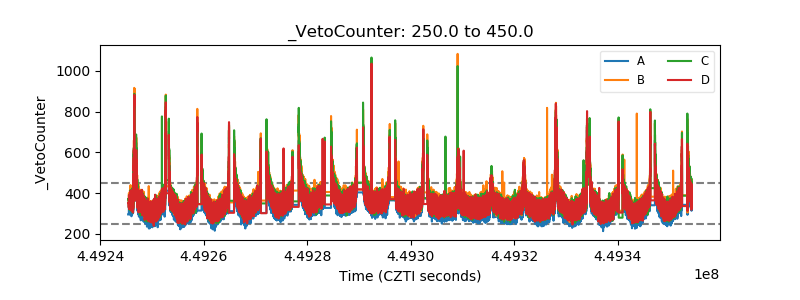 |