| Param | Original file | Final file |
|---|---|---|
| Filename | modeM0/AS1A13_033T02_9000006140cztM0_level2.fits | modeM0/AS1A13_033T02_9000006140cztM0_level2_quad_clean.evt |
| Size (bytes) | 604,765,440 | 629,680,320 |
| Size | 576.7 MB | 600.5 MB |
| Events in quadrant A | 3,584,616 | 3,731,035 |
| Events in quadrant B | 3,301,066 | 3,623,465 |
| Events in quadrant C | 3,660,414 | 3,725,444 |
| Events in quadrant D | 3,058,578 | 3,286,139 |
| Mode M9 | |||
|---|---|---|---|
| Quadrant | BADHDUFLAG | Total packets | Discarded packets |
| A | 0 | 82 | 0 |
| B | 0 | 83 | 0 |
| C | 0 | 83 | 0 |
| D | 0 | 83 | 0 |
| Mode SS | |||
|---|---|---|---|
| Quadrant | BADHDUFLAG | Total packets | Discarded packets |
| A | 0 | 1394 | 0 |
| B | 0 | 1394 | 0 |
| C | 0 | 1394 | 0 |
| D | 0 | 1394 | 0 |
| Mode M0 | |||
|---|---|---|---|
| Quadrant | BADHDUFLAG | Total packets | Discarded packets |
| A | 0 | 222787 | 0 |
| B | 0 | 256899 | 0 |
| C | 0 | 143401 | 0 |
| D | 0 | 184534 | 0 |
| Quadrant | Total seconds | Saturated seconds | Saturation percentage |
|---|---|---|---|
| A | 68574 | 2084 | 3.039053% |
| B | 68575 | 10373 | 15.126504% |
| C | 68574 | 568 | 0.828302% |
| D | 68573 | 3709 | 5.408834% |
Noise dominated data is calculated using 1-second bins in cleaned event files. If a bin has >2000 counts, and if more than 50% of those come from <1% of pixels, then it is considered to be noise-dominated and hence unusable.
| Quadrant | # 1 sec bins | Bins with >0 counts | Bins with >2000 counts | High rate bins dominated by noise | Noise dominated (total time) | Noise dominated (detector-on time) | Marked lightcurve |
|---|---|---|---|---|---|---|---|
| A | 86230 | 68571 | 0 | 0 | 0.00% | 0.00% |  |
| B | 86230 | 68555 | 0 | 0 | 0.00% | 0.00% | 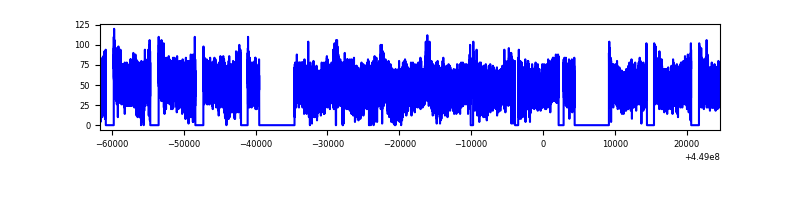 |
| C | 86230 | 68576 | 0 | 0 | 0.00% | 0.00% |  |
| D | 86228 | 68553 | 0 | 0 | 0.00% | 0.00% |  |
Top three noisy pixels from each quadrant. If the there are fewer than three noisy pixels in the level2.evt file, extra rows are filled as -1
| Pixel properties | Quadrant properties | ||||||
|---|---|---|---|---|---|---|---|
| Quadrant | DetID | PixID | Counts | Sigma | Mean | Median | Sigma |
| A | 7 | 110 | 2995 | 8.84 | 933 | 868 | 240.6 |
| A | 15 | 236 | 2879 | 8.36 | 933 | 868 | 240.6 |
| A | 0 | 29 | 2859 | 8.28 | 933 | 868 | 240.6 |
| B | 2 | 9 | 3116 | 13.15 | 871 | 826 | 174.2 |
| B | 2 | 8 | 2486 | 9.53 | 871 | 826 | 174.2 |
| B | 3 | 17 | 2285 | 8.37 | 871 | 826 | 174.2 |
| C | 3 | 202 | 2854 | 7.78 | 966 | 895 | 251.8 |
| C | 1 | 81 | 2775 | 7.47 | 966 | 895 | 251.8 |
| C | 3 | 203 | 2723 | 7.26 | 966 | 895 | 251.8 |
| D | 8 | 176 | 2626 | 7.49 | 877 | 795 | 244.4 |
| D | 10 | 189 | 2257 | 5.98 | 877 | 795 | 244.4 |
| D | 3 | 14 | 2256 | 5.98 | 877 | 795 | 244.4 |
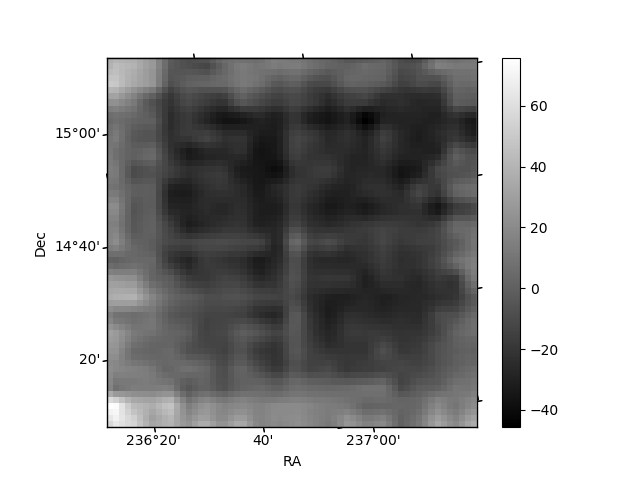
Histogram calculated using DETX and DETY for each event in the final _common_clean file
| Quadrant A |  |
 |
Quadrant B |
|---|---|---|---|
| Quadrant D |  |
 |
Quadrant C |
| Plot type | Count rate plots | Images |
|---|---|---|
| Comparison with Poisson distribution Blue bars denote a histogram of data divided into 1 sec bins. Red curve is a Poisson curve with rate = median count rate of data. |
 |
 |
| Quadrant-wise count rates Data is divided into 100 sec bins |
 |
|
| Module-wise count rates for Quadrant A Data is divided into 100 sec bins |
 |
 |
| Module-wise count rates for Quadrant B Data is divided into 100 sec bins |
 |
 |
| Module-wise count rates for Quadrant C Data is divided into 100 sec bins |
 |
 |
| Module-wise count rates for Quadrant D Data is divided into 100 sec bins |
 |
 |
| Parameter | Plot |
|---|---|
| CZT HV Monitor |  |
| D_VDD | 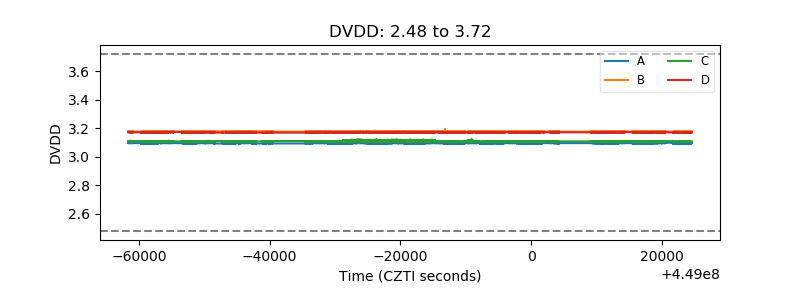 |
| Temperature 1 | 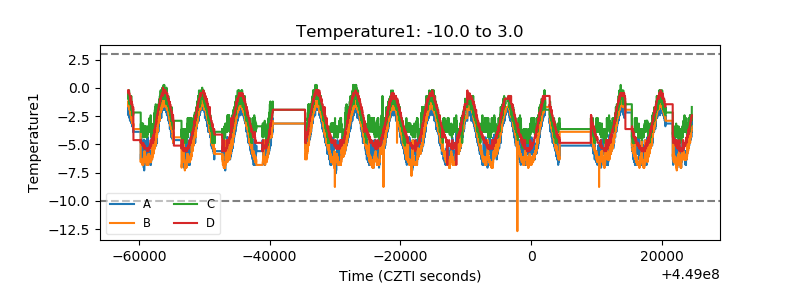 |
| Veto HV Monitor |  |
| Veto LLD |  |
| Alpha Counter |  |
| _CPM_Rate |  |
| CZT Counter |  |
| +2.5 Volts monitor |  |
| +5 Volts monitor | 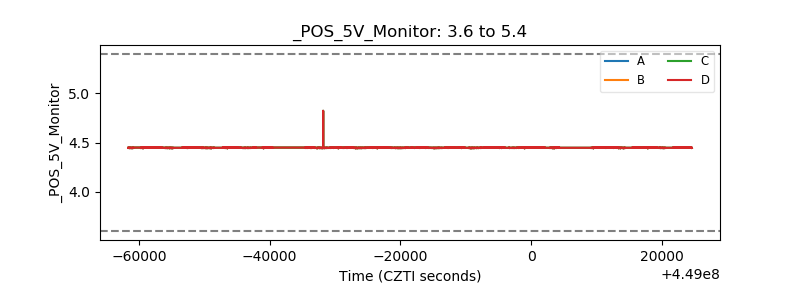 |
| _ROLL_ROT | 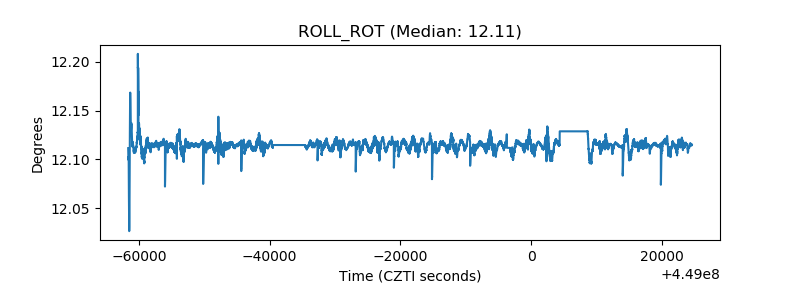 |
| _Roll_DEC | 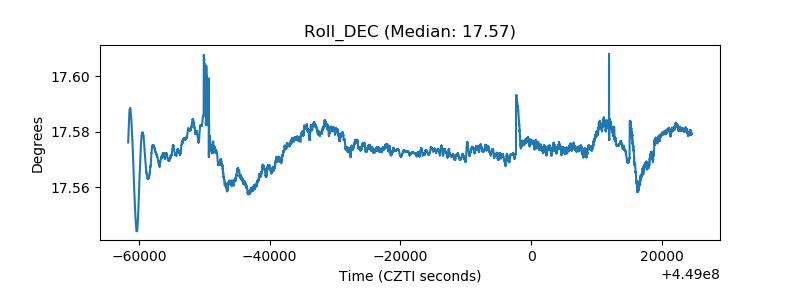 |
| _Roll_RA |  |
| Veto Counter |  |