| Param | Original file | Final file |
|---|---|---|
| Filename | modeM0/AS1C07_001T01_9000006136cztM0_level2.fits | modeM0/AS1C07_001T01_9000006136cztM0_level2_quad_clean.evt |
| Size (bytes) | 407,571,840 | 563,734,080 |
| Size | 388.7 MB | 537.6 MB |
| Events in quadrant A | 2,419,570 | 3,714,990 |
| Events in quadrant B | 2,056,442 | 2,882,723 |
| Events in quadrant C | 2,502,130 | 3,840,807 |
| Events in quadrant D | 2,105,622 | 3,382,747 |
| Mode M9 | |||
|---|---|---|---|
| Quadrant | BADHDUFLAG | Total packets | Discarded packets |
| A | 0 | 77 | 0 |
| B | 0 | 77 | 0 |
| C | 0 | 77 | 0 |
| D | 0 | 77 | 0 |
| Mode SS | |||
|---|---|---|---|
| Quadrant | BADHDUFLAG | Total packets | Discarded packets |
| A | 0 | 958 | 0 |
| B | 0 | 958 | 0 |
| C | 0 | 958 | 0 |
| D | 0 | 958 | 0 |
| Mode M0 | |||
|---|---|---|---|
| Quadrant | BADHDUFLAG | Total packets | Discarded packets |
| A | 0 | 157712 | 0 |
| B | 0 | 212947 | 0 |
| C | 0 | 97919 | 0 |
| D | 0 | 117467 | 0 |
| Quadrant | Total seconds | Saturated seconds | Saturation percentage |
|---|---|---|---|
| A | 47400 | 1742 | 3.675105% |
| B | 47401 | 13617 | 28.727242% |
| C | 47401 | 309 | 0.651885% |
| D | 47401 | 1365 | 2.879686% |
Noise dominated data is calculated using 1-second bins in cleaned event files. If a bin has >2000 counts, and if more than 50% of those come from <1% of pixels, then it is considered to be noise-dominated and hence unusable.
| Quadrant | # 1 sec bins | Bins with >0 counts | Bins with >2000 counts | High rate bins dominated by noise | Noise dominated (total time) | Noise dominated (detector-on time) | Marked lightcurve |
|---|---|---|---|---|---|---|---|
| A | 59734 | 47395 | 0 | 0 | 0.00% | 0.00% |  |
| B | 59734 | 47251 | 0 | 0 | 0.00% | 0.00% |  |
| C | 59734 | 47402 | 0 | 0 | 0.00% | 0.00% |  |
| D | 59734 | 47344 | 0 | 0 | 0.00% | 0.00% | 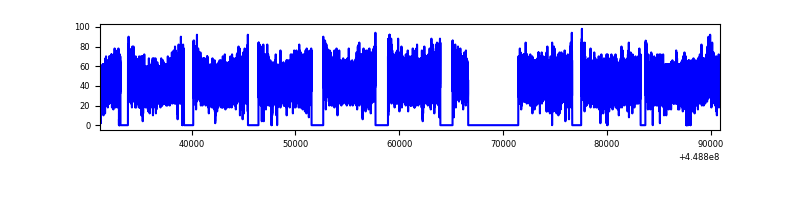 |
Top three noisy pixels from each quadrant. If the there are fewer than three noisy pixels in the level2.evt file, extra rows are filled as -1
| Pixel properties | Quadrant properties | ||||||
|---|---|---|---|---|---|---|---|
| Quadrant | DetID | PixID | Counts | Sigma | Mean | Median | Sigma |
| A | 7 | 110 | 1993 | 8.57 | 631 | 593 | 163.3 |
| A | 0 | 29 | 1972 | 8.44 | 631 | 593 | 163.3 |
| A | 15 | 236 | 1927 | 8.17 | 631 | 593 | 163.3 |
| B | 2 | 9 | 1951 | 13.58 | 543 | 519 | 105.4 |
| B | 2 | 8 | 1570 | 9.97 | 543 | 519 | 105.4 |
| B | 3 | 17 | 1466 | 8.98 | 543 | 519 | 105.4 |
| C | 3 | 202 | 1988 | 7.96 | 661 | 616 | 172.3 |
| C | 3 | 203 | 1944 | 7.71 | 661 | 616 | 172.3 |
| C | 1 | 81 | 1943 | 7.7 | 661 | 616 | 172.3 |
| D | 10 | 189 | 1652 | 6.49 | 604 | 549 | 169.8 |
| D | 6 | 38 | 1578 | 6.06 | 604 | 549 | 169.8 |
| D | 3 | 14 | 1543 | 5.85 | 604 | 549 | 169.8 |
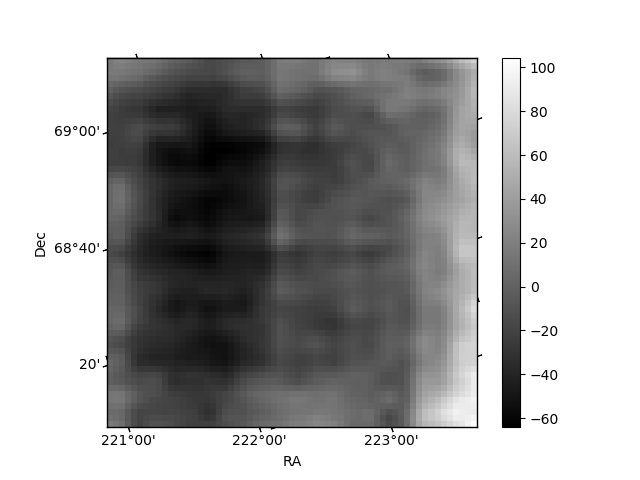
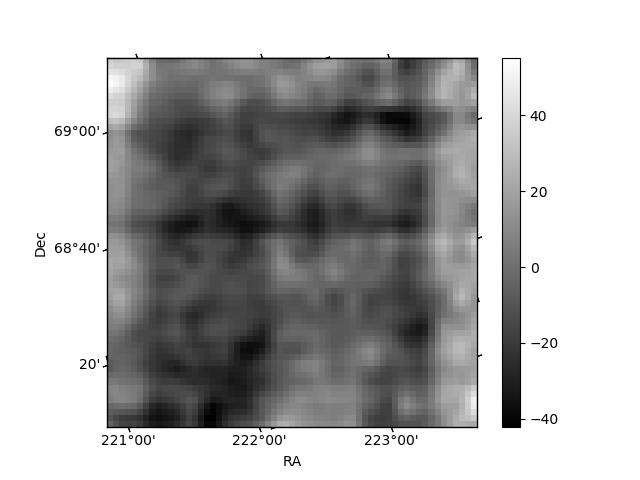
Histogram calculated using DETX and DETY for each event in the final _common_clean file
| Quadrant A |  |
 |
Quadrant B |
|---|---|---|---|
| Quadrant D |  |
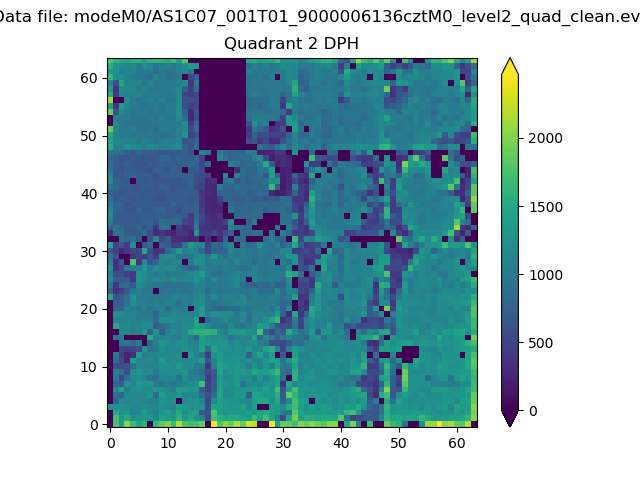 |
Quadrant C |
| Plot type | Count rate plots | Images |
|---|---|---|
| Comparison with Poisson distribution Blue bars denote a histogram of data divided into 1 sec bins. Red curve is a Poisson curve with rate = median count rate of data. |
 |
 |
| Quadrant-wise count rates Data is divided into 100 sec bins |
 |
|
| Module-wise count rates for Quadrant A Data is divided into 100 sec bins |
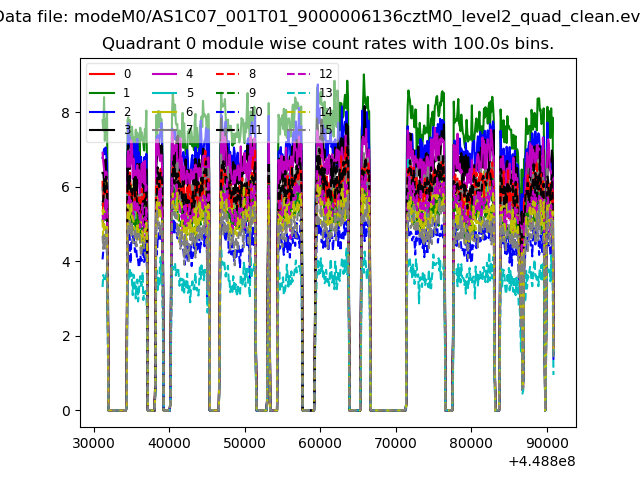 |
 |
| Module-wise count rates for Quadrant B Data is divided into 100 sec bins |
 |
 |
| Module-wise count rates for Quadrant C Data is divided into 100 sec bins |
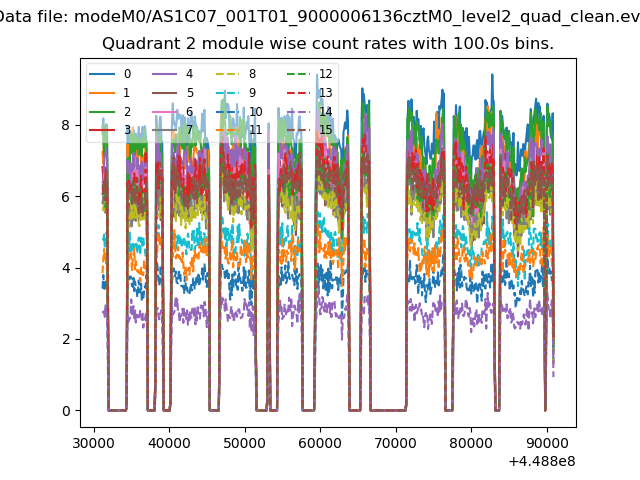 |
 |
| Module-wise count rates for Quadrant D Data is divided into 100 sec bins |
 |
 |
| Parameter | Plot |
|---|---|
| CZT HV Monitor | 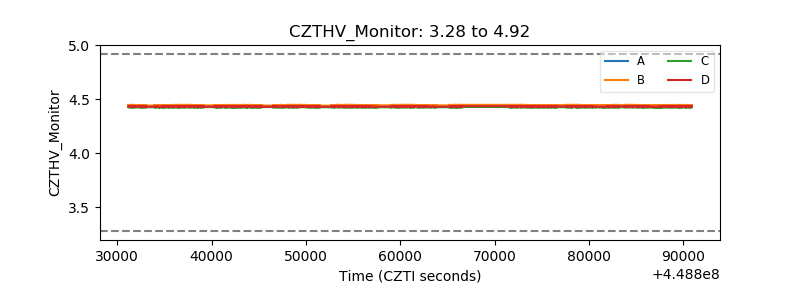 |
| D_VDD |  |
| Temperature 1 |  |
| Veto HV Monitor |  |
| Veto LLD |  |
| Alpha Counter | 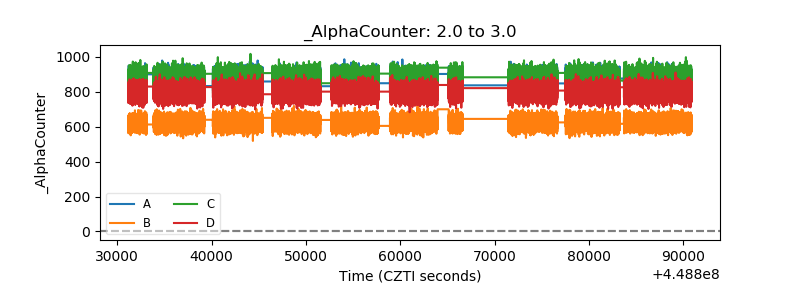 |
| _CPM_Rate |  |
| CZT Counter |  |
| +2.5 Volts monitor | 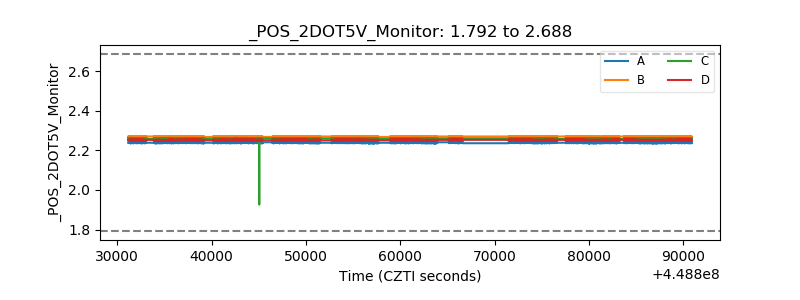 |
| +5 Volts monitor |  |
| _ROLL_ROT |  |
| _Roll_DEC | 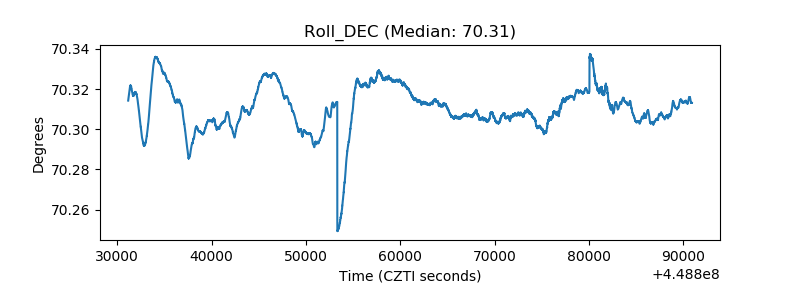 |
| _Roll_RA | 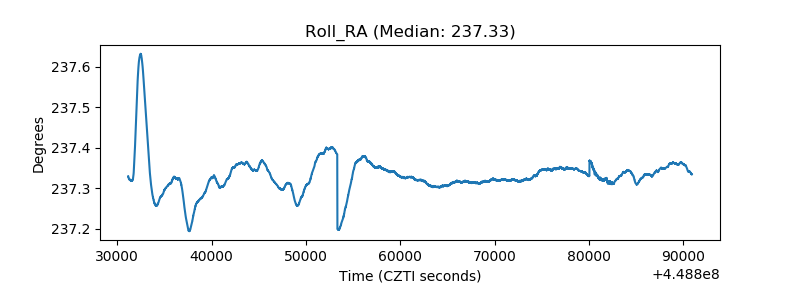 |
| Veto Counter |  |