| Param | Original file | Final file |
|---|---|---|
| Filename | modeM0/AS1T05_187T01_9000006132cztM0_level2.fits | modeM0/AS1T05_187T01_9000006132cztM0_level2_quad_clean.evt |
| Size (bytes) | 463,461,120 | 529,951,680 |
| Size | 442.0 MB | 505.4 MB |
| Events in quadrant A | 2,781,870 | 3,387,576 |
| Events in quadrant B | 2,322,036 | 2,846,783 |
| Events in quadrant C | 2,852,136 | 3,292,545 |
| Events in quadrant D | 2,333,394 | 2,786,529 |
| Mode SS | |||
|---|---|---|---|
| Quadrant | BADHDUFLAG | Total packets | Discarded packets |
| A | 0 | 1102 | 0 |
| B | 0 | 1102 | 0 |
| C | 0 | 1102 | 0 |
| D | 0 | 1102 | 0 |
| Mode M9 | |||
|---|---|---|---|
| Quadrant | BADHDUFLAG | Total packets | Discarded packets |
| A | 0 | 45 | 0 |
| B | 0 | 45 | 0 |
| C | 0 | 45 | 0 |
| D | 0 | 45 | 0 |
| Mode M0 | |||
|---|---|---|---|
| Quadrant | BADHDUFLAG | Total packets | Discarded packets |
| A | 0 | 173069 | 0 |
| B | 0 | 270415 | 0 |
| C | 0 | 112154 | 0 |
| D | 0 | 160737 | 0 |
| Quadrant | Total seconds | Saturated seconds | Saturation percentage |
|---|---|---|---|
| A | 54449 | 1731 | 3.179122% |
| B | 54450 | 17386 | 31.930211% |
| C | 54450 | 339 | 0.622590% |
| D | 54450 | 4624 | 8.492195% |
Noise dominated data is calculated using 1-second bins in cleaned event files. If a bin has >2000 counts, and if more than 50% of those come from <1% of pixels, then it is considered to be noise-dominated and hence unusable.
| Quadrant | # 1 sec bins | Bins with >0 counts | Bins with >2000 counts | High rate bins dominated by noise | Noise dominated (total time) | Noise dominated (detector-on time) | Marked lightcurve |
|---|---|---|---|---|---|---|---|
| A | 58930 | 54449 | 0 | 0 | 0.00% | 0.00% |  |
| B | 58931 | 54383 | 0 | 0 | 0.00% | 0.00% | 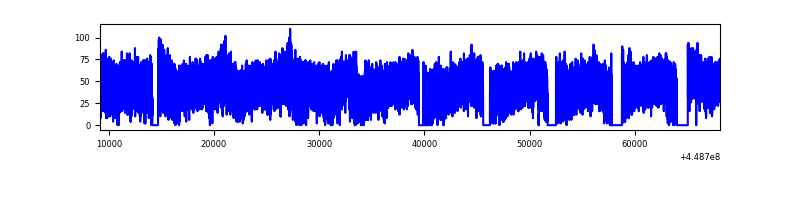 |
| C | 58931 | 54449 | 0 | 0 | 0.00% | 0.00% |  |
| D | 58931 | 54294 | 0 | 0 | 0.00% | 0.00% | 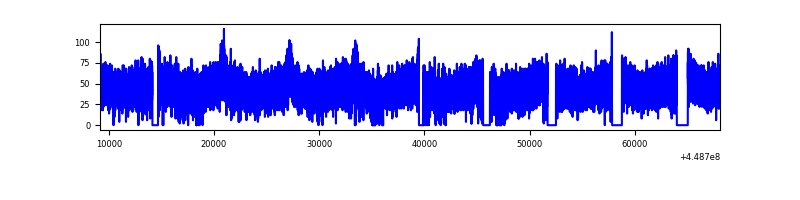 |
Top three noisy pixels from each quadrant. If the there are fewer than three noisy pixels in the level2.evt file, extra rows are filled as -1
| Pixel properties | Quadrant properties | ||||||
|---|---|---|---|---|---|---|---|
| Quadrant | DetID | PixID | Counts | Sigma | Mean | Median | Sigma |
| A | 7 | 110 | 2287 | 8.65 | 725 | 678 | 185.9 |
| A | 15 | 236 | 2226 | 8.33 | 725 | 678 | 185.9 |
| A | 0 | 29 | 2172 | 8.03 | 725 | 678 | 185.9 |
| B | 2 | 9 | 2157 | 12.75 | 615 | 582 | 123.4 |
| B | 2 | 8 | 1671 | 8.82 | 615 | 582 | 123.4 |
| B | 3 | 17 | 1621 | 8.41 | 615 | 582 | 123.4 |
| C | 3 | 202 | 2272 | 8.04 | 753 | 697 | 195.9 |
| C | 1 | 81 | 2151 | 7.42 | 753 | 697 | 195.9 |
| C | 1 | 80 | 2149 | 7.41 | 753 | 697 | 195.9 |
| D | 8 | 176 | 1942 | 7.16 | 670 | 606 | 186.7 |
| D | 10 | 189 | 1736 | 6.05 | 670 | 606 | 186.7 |
| D | 4 | 12 | 1724 | 5.99 | 670 | 606 | 186.7 |
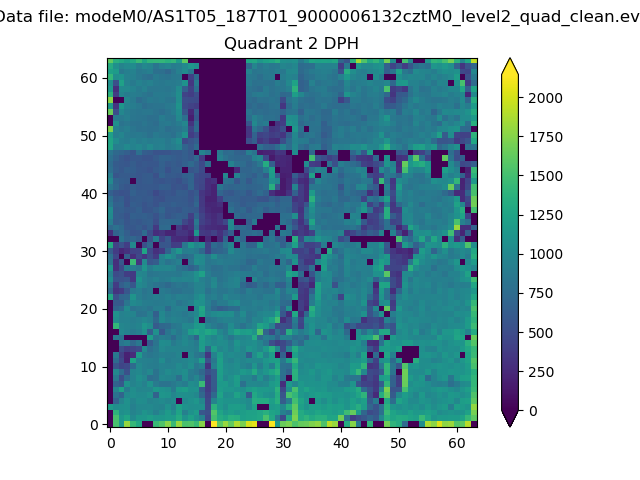
Histogram calculated using DETX and DETY for each event in the final _common_clean file
| Quadrant A |  |
 |
Quadrant B |
|---|---|---|---|
| Quadrant D | 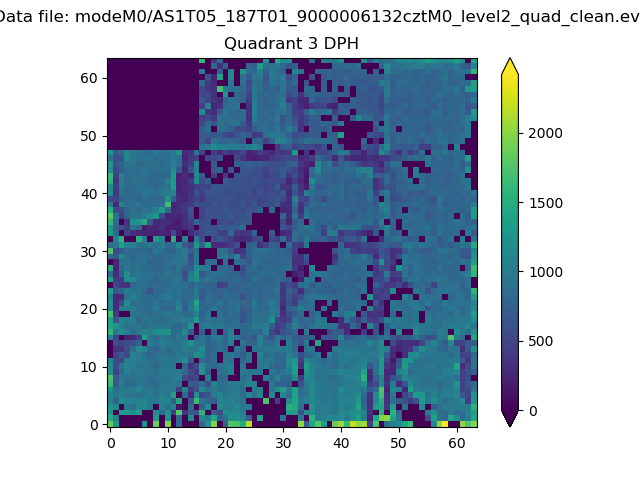 |
 |
Quadrant C |
| Plot type | Count rate plots | Images |
|---|---|---|
| Comparison with Poisson distribution Blue bars denote a histogram of data divided into 1 sec bins. Red curve is a Poisson curve with rate = median count rate of data. |
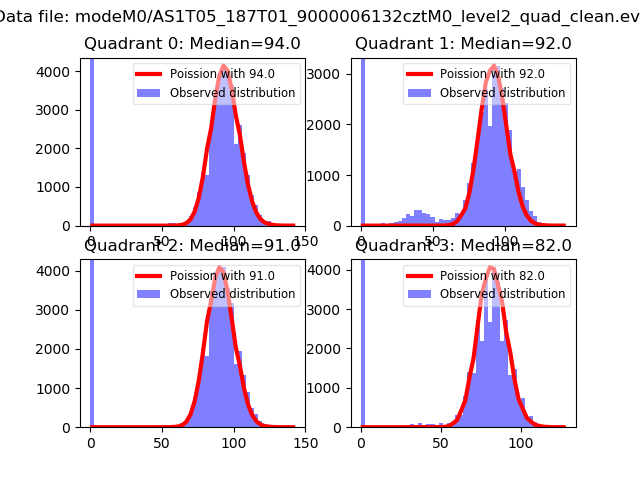 |
 |
| Quadrant-wise count rates Data is divided into 100 sec bins |
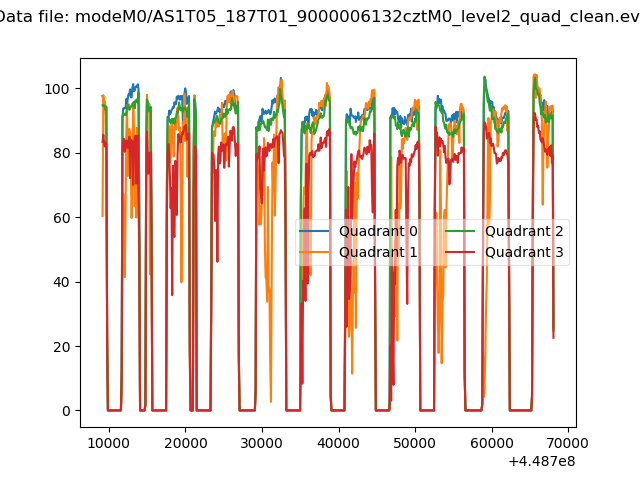 |
|
| Module-wise count rates for Quadrant A Data is divided into 100 sec bins |
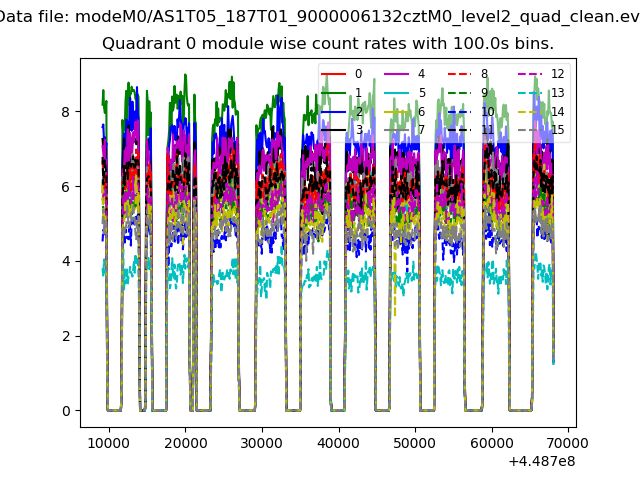 |
 |
| Module-wise count rates for Quadrant B Data is divided into 100 sec bins |
 |
 |
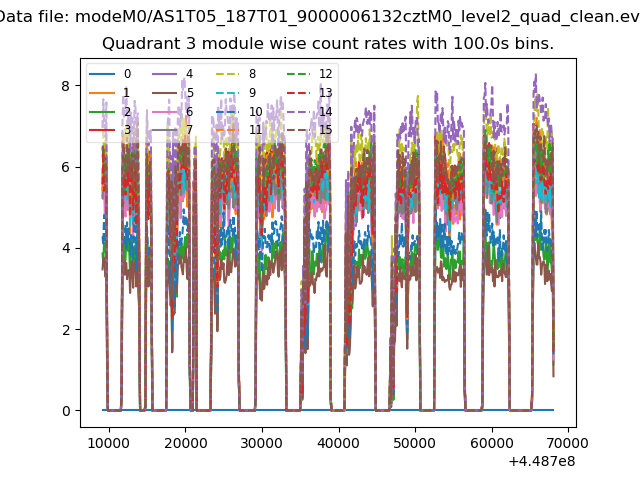
| Module-wise count rates for Quadrant C Data is divided into 100 sec bins |
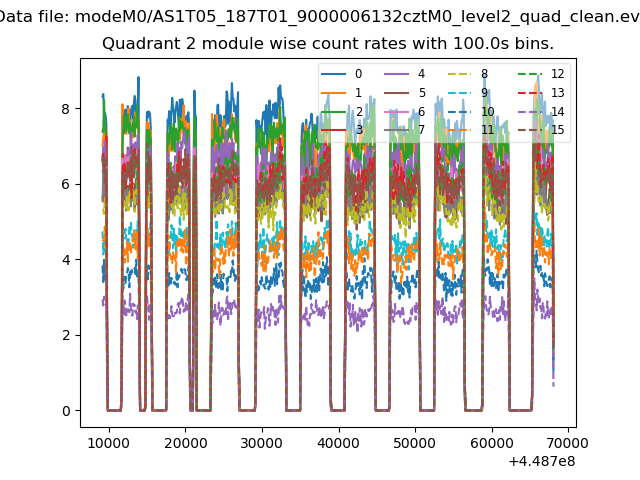 |
 |
| Module-wise count rates for Quadrant D Data is divided into 100 sec bins |
 |
 |
| Parameter | Plot |
|---|---|
| CZT HV Monitor |  |
| D_VDD |  |
| Temperature 1 |  |
| Veto HV Monitor |  |
| Veto LLD |  |
| Alpha Counter |  |
| _CPM_Rate |  |
| CZT Counter |  |
| +2.5 Volts monitor |  |
| +5 Volts monitor |  |
| _ROLL_ROT |  |
| _Roll_DEC |  |
| _Roll_RA |  |
| Veto Counter | 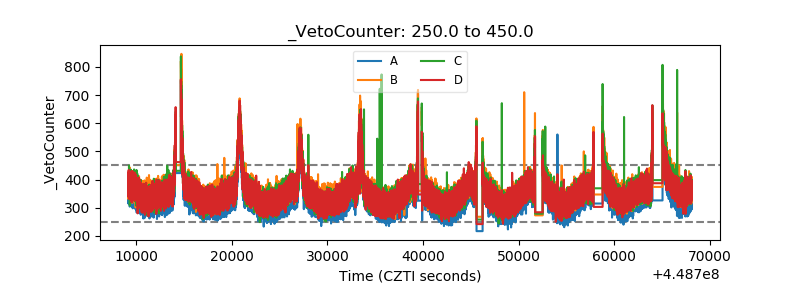 |