| Param | Original file | Final file |
|---|---|---|
| Filename | modeM0/AS1T05_186T01_9000006130cztM0_level2.fits | modeM0/AS1T05_186T01_9000006130cztM0_level2_quad_clean.evt |
| Size (bytes) | 700,603,200 | 683,910,720 |
| Size | 668.1 MB | 652.2 MB |
| Events in quadrant A | 4,202,552 | 4,254,368 |
| Events in quadrant B | 3,668,832 | 3,197,774 |
| Events in quadrant C | 4,367,246 | 4,406,535 |
| Events in quadrant D | 3,453,112 | 3,342,143 |
| Mode M0 | |||
|---|---|---|---|
| Quadrant | BADHDUFLAG | Total packets | Discarded packets |
| A | 0 | 277792 | 0 |
| B | 0 | 379686 | 0 |
| C | 0 | 167093 | 0 |
| D | 0 | 297997 | 0 |
| Mode M9 | |||
|---|---|---|---|
| Quadrant | BADHDUFLAG | Total packets | Discarded packets |
| A | 0 | 106 | 0 |
| B | 0 | 106 | 0 |
| C | 0 | 106 | 0 |
| D | 0 | 106 | 0 |
| Mode SS | |||
|---|---|---|---|
| Quadrant | BADHDUFLAG | Total packets | Discarded packets |
| A | 0 | 1635 | 0 |
| B | 0 | 1636 | 0 |
| C | 0 | 1637 | 0 |
| D | 0 | 1634 | 0 |
| Quadrant | Total seconds | Saturated seconds | Saturation percentage |
|---|---|---|---|
| A | 80334 | 4719 | 5.874225% |
| B | 80325 | 22094 | 27.505758% |
| C | 80355 | 612 | 0.761620% |
| D | 80335 | 11113 | 13.833323% |
Noise dominated data is calculated using 1-second bins in cleaned event files. If a bin has >2000 counts, and if more than 50% of those come from <1% of pixels, then it is considered to be noise-dominated and hence unusable.
| Quadrant | # 1 sec bins | Bins with >0 counts | Bins with >2000 counts | High rate bins dominated by noise | Noise dominated (total time) | Noise dominated (detector-on time) | Marked lightcurve |
|---|---|---|---|---|---|---|---|
| A | 90486 | 80366 | 0 | 0 | 0.00% | 0.00% |  |
| B | 90485 | 80204 | 0 | 0 | 0.00% | 0.00% |  |
| C | 90485 | 80382 | 0 | 0 | 0.00% | 0.00% |  |
| D | 90485 | 80135 | 0 | 0 | 0.00% | 0.00% | 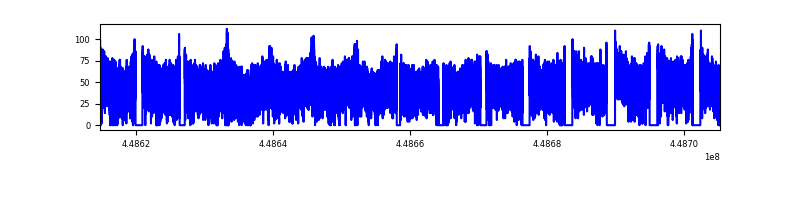 |
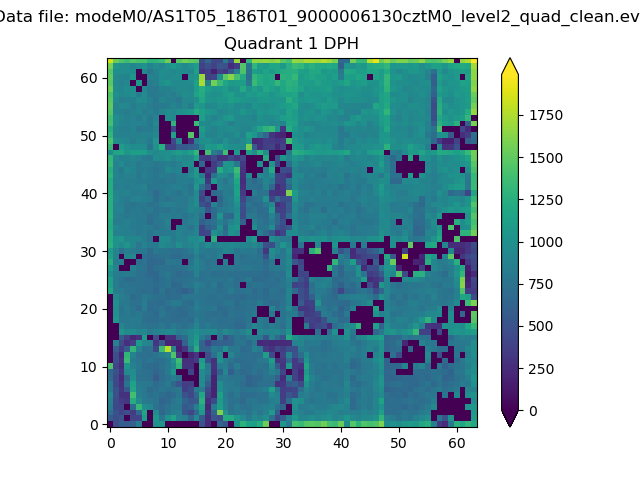
Top three noisy pixels from each quadrant. If the there are fewer than three noisy pixels in the level2.evt file, extra rows are filled as -1
| Pixel properties | Quadrant properties | ||||||
|---|---|---|---|---|---|---|---|
| Quadrant | DetID | PixID | Counts | Sigma | Mean | Median | Sigma |
| A | 7 | 110 | 3429 | 8.74 | 1096 | 1023 | 275.3 |
| A | 0 | 29 | 3347 | 8.44 | 1096 | 1023 | 275.3 |
| A | 15 | 236 | 3310 | 8.31 | 1096 | 1023 | 275.3 |
| B | 2 | 9 | 3389 | 12.93 | 970 | 922 | 190.8 |
| B | 2 | 8 | 2716 | 9.4 | 970 | 922 | 190.8 |
| B | 3 | 17 | 2612 | 8.86 | 970 | 922 | 190.8 |
| C | 1 | 81 | 3337 | 7.55 | 1156 | 1073 | 299.9 |
| C | 3 | 202 | 3272 | 7.33 | 1156 | 1073 | 299.9 |
| C | 1 | 80 | 3222 | 7.16 | 1156 | 1073 | 299.9 |
| D | 10 | 189 | 2537 | 5.91 | 994 | 901 | 276.8 |
| D | 7 | 3 | 2535 | 5.9 | 994 | 901 | 276.8 |
| D | 12 | 6 | 2474 | 5.68 | 994 | 901 | 276.8 |
Histogram calculated using DETX and DETY for each event in the final _common_clean file
| Quadrant A |  |
 |
Quadrant B |
|---|---|---|---|
| Quadrant D |  |
 |
Quadrant C |
| Plot type | Count rate plots | Images |
|---|---|---|
| Comparison with Poisson distribution Blue bars denote a histogram of data divided into 1 sec bins. Red curve is a Poisson curve with rate = median count rate of data. |
 |
 |
| Quadrant-wise count rates Data is divided into 100 sec bins |
 |
|
| Module-wise count rates for Quadrant A Data is divided into 100 sec bins |
 |
 |
| Module-wise count rates for Quadrant B Data is divided into 100 sec bins |
 |
 |
| Module-wise count rates for Quadrant C Data is divided into 100 sec bins |
 |
 |
| Module-wise count rates for Quadrant D Data is divided into 100 sec bins |
 |
 |
| Parameter | Plot |
|---|---|
| CZT HV Monitor |  |
| D_VDD |  |
| Temperature 1 |  |
| Veto HV Monitor |  |
| Veto LLD | 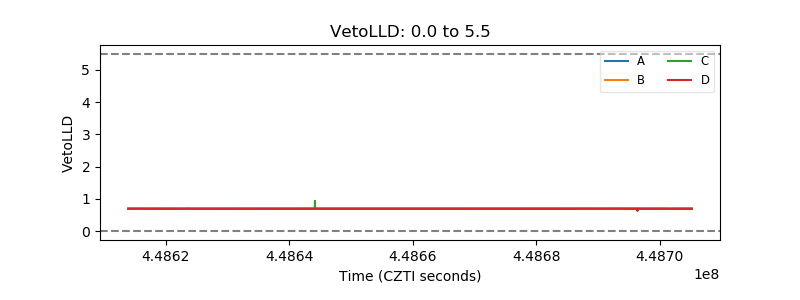 |
| Alpha Counter | 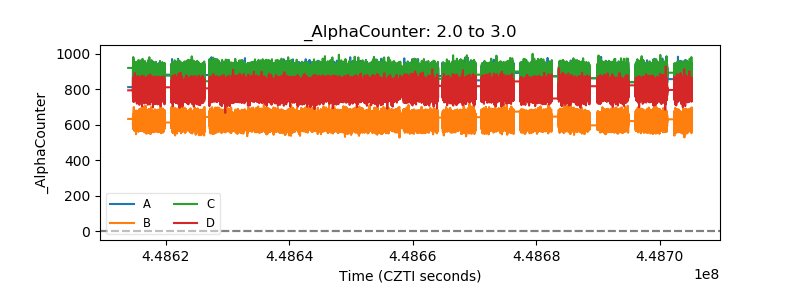 |
| _CPM_Rate |  |
| CZT Counter |  |
| +2.5 Volts monitor |  |
| +5 Volts monitor |  |
| _ROLL_ROT | 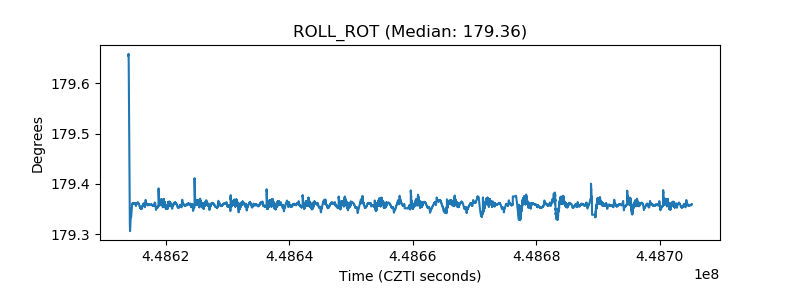 |
| _Roll_DEC |  |
| _Roll_RA |  |
| Veto Counter | 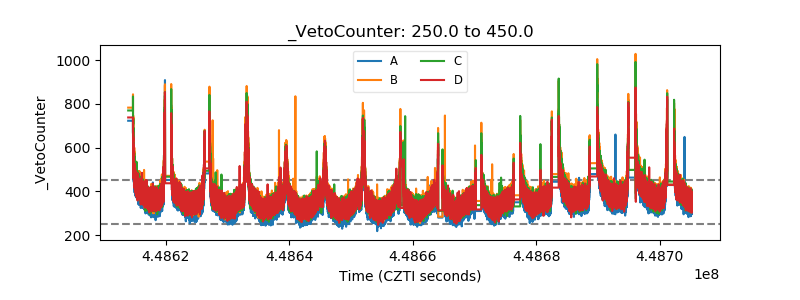 |