| Param | Original file | Final file |
|---|---|---|
| Filename | modeM0/AS1T05_185T01_9000006128cztM0_level2.fits | modeM0/AS1T05_185T01_9000006128cztM0_level2_quad_clean.evt |
| Size (bytes) | 886,383,360 | 900,593,280 |
| Size | 845.3 MB | 858.9 MB |
| Events in quadrant A | 5,148,030 | 5,364,389 |
| Events in quadrant B | 5,025,132 | 5,392,532 |
| Events in quadrant C | 5,449,500 | 5,308,653 |
| Events in quadrant D | 4,289,988 | 4,290,362 |
| Mode SS | |||
|---|---|---|---|
| Quadrant | BADHDUFLAG | Total packets | Discarded packets |
| A | 0 | 2046 | 0 |
| B | 0 | 2046 | 0 |
| C | 0 | 2046 | 0 |
| D | 0 | 2046 | 0 |
| Mode M0 | |||
|---|---|---|---|
| Quadrant | BADHDUFLAG | Total packets | Discarded packets |
| A | 0 | 352207 | 0 |
| B | 0 | 326922 | 0 |
| C | 0 | 216449 | 0 |
| D | 0 | 373826 | 0 |
| Mode M9 | |||
|---|---|---|---|
| Quadrant | BADHDUFLAG | Total packets | Discarded packets |
| A | 0 | 141 | 0 |
| B | 0 | 141 | 0 |
| C | 0 | 141 | 0 |
| D | 0 | 141 | 0 |
| Quadrant | Total seconds | Saturated seconds | Saturation percentage |
|---|---|---|---|
| A | 100946 | 7084 | 7.017613% |
| B | 100945 | 9026 | 8.941503% |
| C | 100945 | 1494 | 1.480014% |
| D | 100946 | 13932 | 13.801438% |
Noise dominated data is calculated using 1-second bins in cleaned event files. If a bin has >2000 counts, and if more than 50% of those come from <1% of pixels, then it is considered to be noise-dominated and hence unusable.
| Quadrant | # 1 sec bins | Bins with >0 counts | Bins with >2000 counts | High rate bins dominated by noise | Noise dominated (total time) | Noise dominated (detector-on time) | Marked lightcurve |
|---|---|---|---|---|---|---|---|
| A | 115006 | 100876 | 0 | 0 | 0.00% | 0.00% |  |
| B | 115006 | 100916 | 0 | 0 | 0.00% | 0.00% |  |
| C | 115006 | 100935 | 0 | 0 | 0.00% | 0.00% |  |
| D | 115006 | 100719 | 0 | 0 | 0.00% | 0.00% |  |
Top three noisy pixels from each quadrant. If the there are fewer than three noisy pixels in the level2.evt file, extra rows are filled as -1
| Pixel properties | Quadrant properties | ||||||
|---|---|---|---|---|---|---|---|
| Quadrant | DetID | PixID | Counts | Sigma | Mean | Median | Sigma |
| A | 7 | 110 | 4207 | 8.74 | 1343 | 1259 | 337.1 |
| A | 0 | 29 | 4084 | 8.38 | 1343 | 1259 | 337.1 |
| A | 15 | 236 | 4058 | 8.3 | 1343 | 1259 | 337.1 |
| B | 2 | 9 | 4603 | 12.71 | 1328 | 1263 | 262.7 |
| B | 2 | 8 | 3742 | 9.43 | 1328 | 1263 | 262.7 |
| B | 3 | 17 | 3649 | 9.08 | 1328 | 1263 | 262.7 |
| C | 3 | 202 | 4309 | 7.97 | 1440 | 1342 | 372.2 |
| C | 3 | 203 | 4265 | 7.85 | 1440 | 1342 | 372.2 |
| C | 1 | 81 | 4151 | 7.55 | 1440 | 1342 | 372.2 |
| D | 10 | 189 | 3080 | 5.87 | 1232 | 1122 | 333.4 |
| D | 10 | 113 | 3060 | 5.81 | 1232 | 1122 | 333.4 |
| D | 4 | 16 | 3059 | 5.81 | 1232 | 1122 | 333.4 |
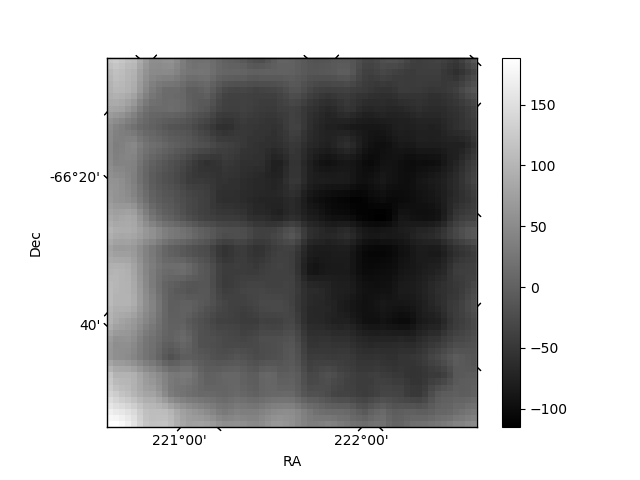
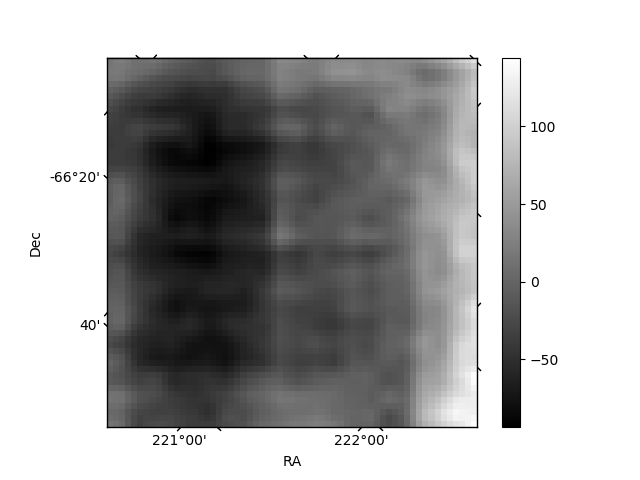
Histogram calculated using DETX and DETY for each event in the final _common_clean file
| Quadrant A |  |
 |
Quadrant B |
|---|---|---|---|
| Quadrant D |  |
 |
Quadrant C |
| Plot type | Count rate plots | Images |
|---|---|---|
| Comparison with Poisson distribution Blue bars denote a histogram of data divided into 1 sec bins. Red curve is a Poisson curve with rate = median count rate of data. |
 |
 |
| Quadrant-wise count rates Data is divided into 100 sec bins |
 |
|
| Module-wise count rates for Quadrant A Data is divided into 100 sec bins |
 |
 |
| Module-wise count rates for Quadrant B Data is divided into 100 sec bins |
 |
 |
| Module-wise count rates for Quadrant C Data is divided into 100 sec bins |
 |
 |
| Module-wise count rates for Quadrant D Data is divided into 100 sec bins |
 |
 |
| Parameter | Plot |
|---|---|
| CZT HV Monitor | 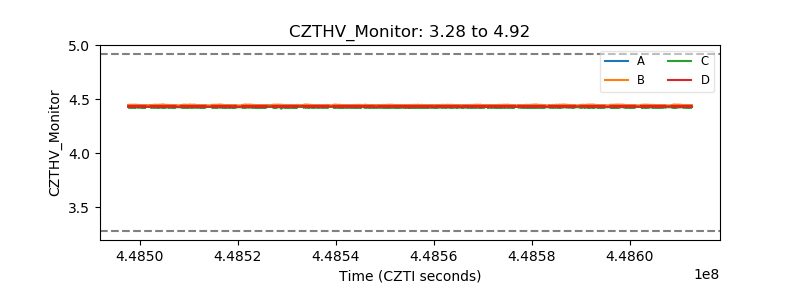 |
| D_VDD |  |
| Temperature 1 |  |
| Veto HV Monitor |  |
| Veto LLD |  |
| Alpha Counter |  |
| _CPM_Rate |  |
| CZT Counter |  |
| +2.5 Volts monitor |  |
| +5 Volts monitor |  |
| _ROLL_ROT | 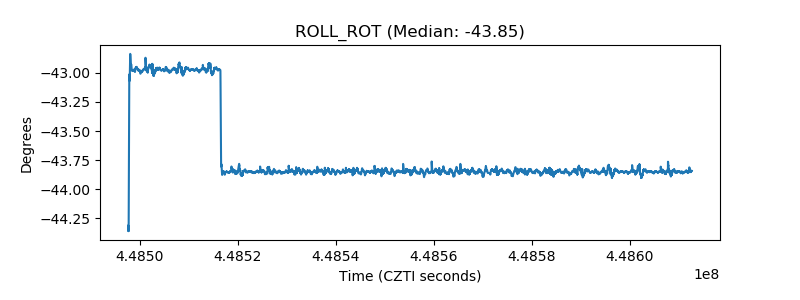 |
| _Roll_DEC |  |
| _Roll_RA |  |
| Veto Counter |  |