| Param | Original file | Final file |
|---|---|---|
| Filename | modeM0/AS1A13_028T01_9000006122cztM0_level2.fits | modeM0/AS1A13_028T01_9000006122cztM0_level2_quad_clean.evt |
| Size (bytes) | 1,467,014,400 | 1,406,491,200 |
| Size | 1.4 GB | 1.3 GB |
| Events in quadrant A | 8,776,820 | 8,413,931 |
| Events in quadrant B | 8,502,416 | 8,510,037 |
| Events in quadrant C | 8,429,930 | 7,326,986 |
| Events in quadrant D | 7,465,700 | 7,107,370 |
| Mode SS | |||
|---|---|---|---|
| Quadrant | BADHDUFLAG | Total packets | Discarded packets |
| A | 0 | 3332 | 0 |
| B | 0 | 3330 | 0 |
| C | 0 | 3332 | 0 |
| D | 0 | 3332 | 0 |
| Mode M9 | |||
|---|---|---|---|
| Quadrant | BADHDUFLAG | Total packets | Discarded packets |
| A | 0 | 216 | 0 |
| B | 0 | 217 | 0 |
| C | 0 | 217 | 0 |
| D | 0 | 217 | 0 |
| Mode M0 | |||
|---|---|---|---|
| Quadrant | BADHDUFLAG | Total packets | Discarded packets |
| A | 0 | 533782 | 0 |
| B | 0 | 385707 | 0 |
| C | 0 | 494745 | 0 |
| D | 0 | 445220 | 0 |
| Quadrant | Total seconds | Saturated seconds | Saturation percentage |
|---|---|---|---|
| A | 164021 | 5215 | 3.179471% |
| B | 164050 | 5766 | 3.514782% |
| C | 164044 | 20155 | 12.286338% |
| D | 164019 | 8783 | 5.354867% |
Noise dominated data is calculated using 1-second bins in cleaned event files. If a bin has >2000 counts, and if more than 50% of those come from <1% of pixels, then it is considered to be noise-dominated and hence unusable.
| Quadrant | # 1 sec bins | Bins with >0 counts | Bins with >2000 counts | High rate bins dominated by noise | Noise dominated (total time) | Noise dominated (detector-on time) | Marked lightcurve |
|---|---|---|---|---|---|---|---|
| A | 185116 | 164048 | 0 | 0 | 0.00% | 0.00% |  |
| B | 185116 | 163856 | 0 | 0 | 0.00% | 0.00% | 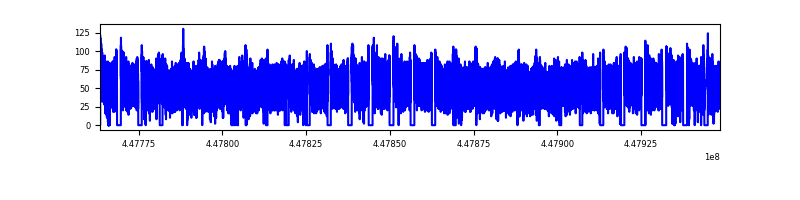 |
| C | 185116 | 164035 | 0 | 0 | 0.00% | 0.00% |  |
| D | 185116 | 163491 | 0 | 0 | 0.00% | 0.00% |  |
Top three noisy pixels from each quadrant. If the there are fewer than three noisy pixels in the level2.evt file, extra rows are filled as -1
| Pixel properties | Quadrant properties | ||||||
|---|---|---|---|---|---|---|---|
| Quadrant | DetID | PixID | Counts | Sigma | Mean | Median | Sigma |
| A | 7 | 110 | 7024 | 8.54 | 2289 | 2141 | 572.1 |
| A | 0 | 29 | 6821 | 8.18 | 2289 | 2141 | 572.1 |
| A | 15 | 236 | 6756 | 8.07 | 2289 | 2141 | 572.1 |
| B | 2 | 9 | 8061 | 13.42 | 2252 | 2142 | 441.1 |
| B | 2 | 8 | 6389 | 9.63 | 2252 | 2142 | 441.1 |
| B | 3 | 17 | 6090 | 8.95 | 2252 | 2142 | 441.1 |
| C | 3 | 202 | 6650 | 7.97 | 2228 | 2074 | 573.9 |
| C | 3 | 203 | 6431 | 7.59 | 2228 | 2074 | 573.9 |
| C | 1 | 81 | 6407 | 7.55 | 2228 | 2074 | 573.9 |
| D | 3 | 14 | 5526 | 6.07 | 2146 | 1945 | 590.1 |
| D | 10 | 189 | 5405 | 5.86 | 2146 | 1945 | 590.1 |
| D | 4 | 12 | 5342 | 5.76 | 2146 | 1945 | 590.1 |
Histogram calculated using DETX and DETY for each event in the final _common_clean file
| Quadrant A |  |
 |
Quadrant B |
|---|---|---|---|
| Quadrant D |  |
 |
Quadrant C |
| Plot type | Count rate plots | Images |
|---|---|---|
| Comparison with Poisson distribution Blue bars denote a histogram of data divided into 1 sec bins. Red curve is a Poisson curve with rate = median count rate of data. |
 |
 |
| Quadrant-wise count rates Data is divided into 100 sec bins |
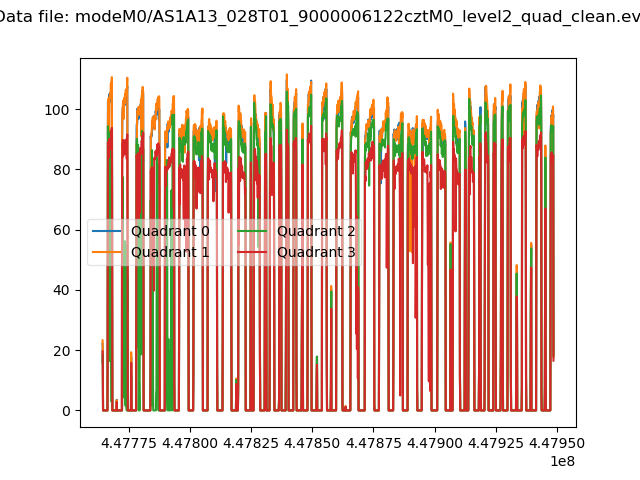 |
|
| Module-wise count rates for Quadrant A Data is divided into 100 sec bins |
 |
 |
| Module-wise count rates for Quadrant B Data is divided into 100 sec bins |
 |
 |
| Module-wise count rates for Quadrant C Data is divided into 100 sec bins |
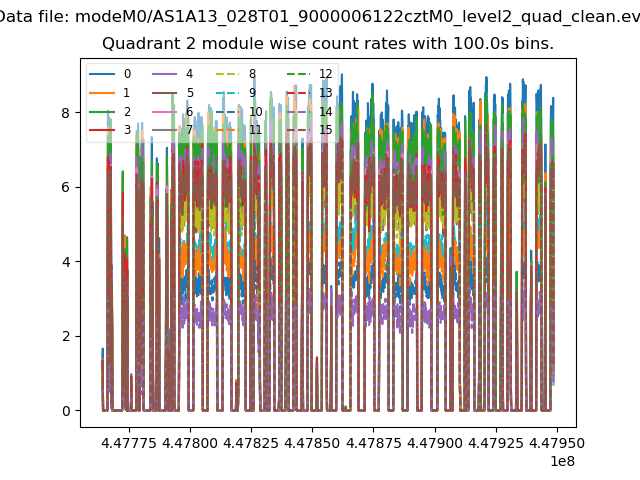 |
 |
| Module-wise count rates for Quadrant D Data is divided into 100 sec bins |
 |
 |
| Parameter | Plot |
|---|---|
| CZT HV Monitor | 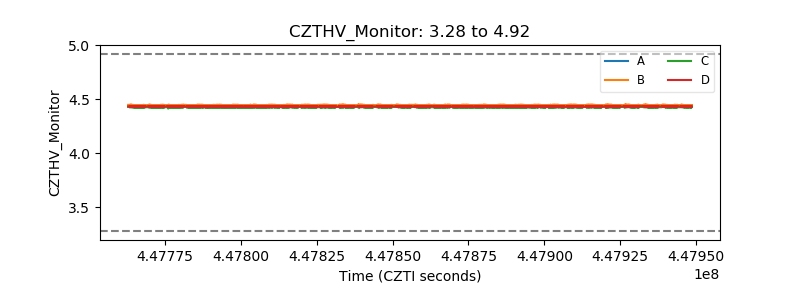 |
| D_VDD |  |
| Temperature 1 |  |
| Veto HV Monitor |  |
| Veto LLD |  |
| Alpha Counter | 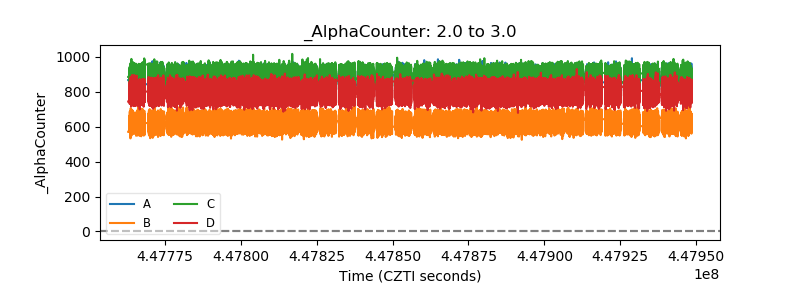 |
| _CPM_Rate |  |
| CZT Counter | 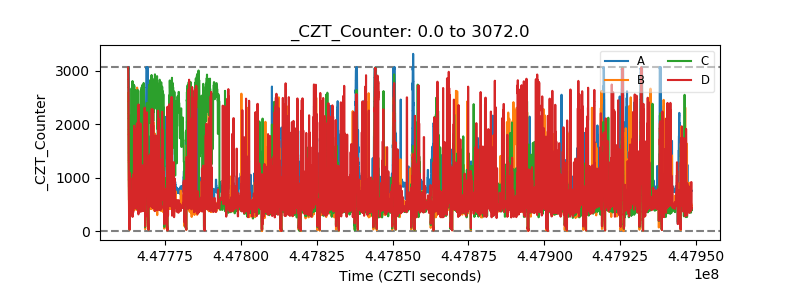 |
| +2.5 Volts monitor | 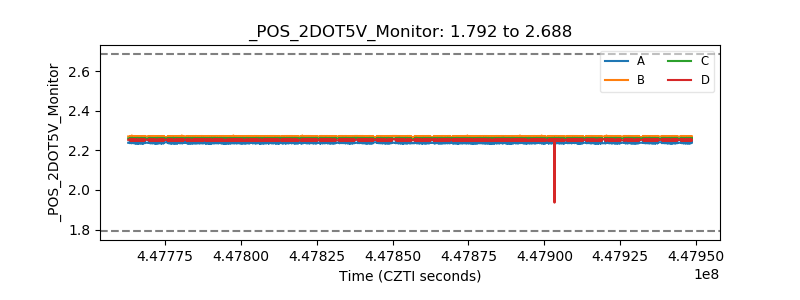 |
| +5 Volts monitor |  |
| _ROLL_ROT |  |
| _Roll_DEC |  |
| _Roll_RA |  |
| Veto Counter |  |