| Param | Original file | Final file |
|---|---|---|
| Filename | modeM0/AS1A13_071T05_9000006120cztM0_level2.fits | modeM0/AS1A13_071T05_9000006120cztM0_level2_quad_clean.evt |
| Size (bytes) | 561,853,440 | 570,107,520 |
| Size | 535.8 MB | 543.7 MB |
| Events in quadrant A | 3,390,394 | 3,567,933 |
| Events in quadrant B | 3,316,100 | 3,624,006 |
| Events in quadrant C | 3,047,390 | 2,699,254 |
| Events in quadrant D | 2,818,262 | 2,941,693 |
| Mode M0 | |||
|---|---|---|---|
| Quadrant | BADHDUFLAG | Total packets | Discarded packets |
| A | 0 | 210536 | 0 |
| B | 0 | 148922 | 0 |
| C | 0 | 284886 | 0 |
| D | 0 | 210294 | 0 |
| Mode M9 | |||
|---|---|---|---|
| Quadrant | BADHDUFLAG | Total packets | Discarded packets |
| A | 0 | 79 | 0 |
| B | 0 | 79 | 0 |
| C | 0 | 79 | 0 |
| D | 0 | 79 | 0 |
| Mode SS | |||
|---|---|---|---|
| Quadrant | BADHDUFLAG | Total packets | Discarded packets |
| A | 0 | 1306 | 0 |
| B | 0 | 1306 | 0 |
| C | 0 | 1306 | 0 |
| D | 0 | 1306 | 0 |
| Quadrant | Total seconds | Saturated seconds | Saturation percentage |
|---|---|---|---|
| A | 64627 | 1833 | 2.836276% |
| B | 64627 | 1574 | 2.435515% |
| C | 64627 | 16741 | 25.904034% |
| D | 64627 | 6871 | 10.631779% |
Noise dominated data is calculated using 1-second bins in cleaned event files. If a bin has >2000 counts, and if more than 50% of those come from <1% of pixels, then it is considered to be noise-dominated and hence unusable.
| Quadrant | # 1 sec bins | Bins with >0 counts | Bins with >2000 counts | High rate bins dominated by noise | Noise dominated (total time) | Noise dominated (detector-on time) | Marked lightcurve |
|---|---|---|---|---|---|---|---|
| A | 72257 | 64619 | 0 | 0 | 0.00% | 0.00% |  |
| B | 72257 | 64606 | 0 | 0 | 0.00% | 0.00% |  |
| C | 72257 | 64589 | 0 | 0 | 0.00% | 0.00% |  |
| D | 72257 | 64461 | 0 | 0 | 0.00% | 0.00% |  |
Top three noisy pixels from each quadrant. If the there are fewer than three noisy pixels in the level2.evt file, extra rows are filled as -1
| Pixel properties | Quadrant properties | ||||||
|---|---|---|---|---|---|---|---|
| Quadrant | DetID | PixID | Counts | Sigma | Mean | Median | Sigma |
| A | 7 | 110 | 2724 | 8.39 | 883 | 822 | 226.7 |
| A | 15 | 236 | 2708 | 8.32 | 883 | 822 | 226.7 |
| A | 14 | 95 | 2638 | 8.01 | 883 | 822 | 226.7 |
| B | 2 | 9 | 3013 | 12.57 | 877 | 834 | 173.3 |
| B | 2 | 8 | 2453 | 9.34 | 877 | 834 | 173.3 |
| B | 3 | 17 | 2398 | 9.02 | 877 | 834 | 173.3 |
| C | 3 | 202 | 2362 | 7.63 | 805 | 747 | 211.6 |
| C | 1 | 81 | 2336 | 7.51 | 805 | 747 | 211.6 |
| C | 3 | 203 | 2310 | 7.39 | 805 | 747 | 211.6 |
| D | 8 | 176 | 2350 | 7.2 | 808 | 732 | 224.6 |
| D | 12 | 6 | 2062 | 5.92 | 808 | 732 | 224.6 |
| D | 10 | 189 | 2051 | 5.87 | 808 | 732 | 224.6 |
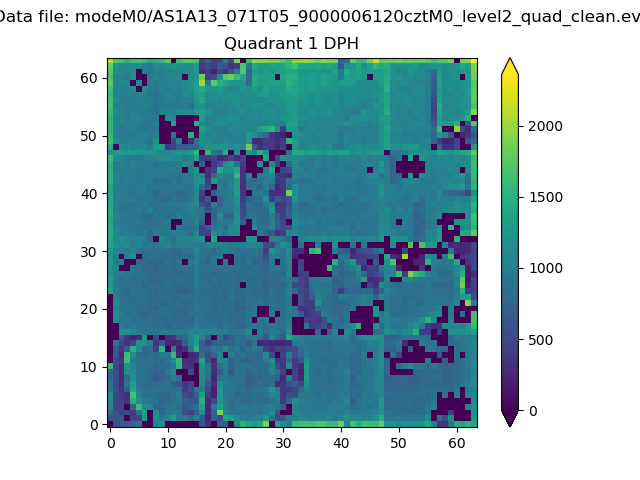
Histogram calculated using DETX and DETY for each event in the final _common_clean file
| Quadrant A |  |
 |
Quadrant B |
|---|---|---|---|
| Quadrant D |  |
 |
Quadrant C |
| Plot type | Count rate plots | Images |
|---|---|---|
| Comparison with Poisson distribution Blue bars denote a histogram of data divided into 1 sec bins. Red curve is a Poisson curve with rate = median count rate of data. |
 |
 |
| Quadrant-wise count rates Data is divided into 100 sec bins |
 |
|
| Module-wise count rates for Quadrant A Data is divided into 100 sec bins |
 |
 |
| Module-wise count rates for Quadrant B Data is divided into 100 sec bins |
 |
 |
| Module-wise count rates for Quadrant C Data is divided into 100 sec bins |
 |
 |
| Module-wise count rates for Quadrant D Data is divided into 100 sec bins |
 |
 |
| Parameter | Plot |
|---|---|
| CZT HV Monitor |  |
| D_VDD | 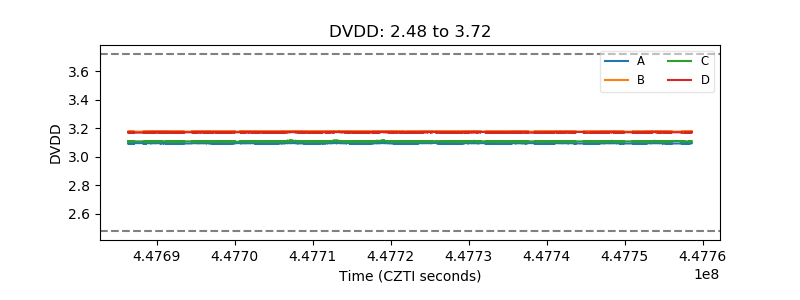 |
| Temperature 1 |  |
| Veto HV Monitor |  |
| Veto LLD |  |
| Alpha Counter |  |
| _CPM_Rate |  |
| CZT Counter |  |
| +2.5 Volts monitor |  |
| +5 Volts monitor |  |
| _ROLL_ROT |  |
| _Roll_DEC |  |
| _Roll_RA |  |
| Veto Counter |  |