| Param | Original file | Final file |
|---|---|---|
| Filename | modeM0/AS1A13_071T04_9000006110cztM0_level2.fits | modeM0/AS1A13_071T04_9000006110cztM0_level2_quad_clean.evt |
| Size (bytes) | 1,268,832,960 | 1,284,819,840 |
| Size | 1.2 GB | 1.2 GB |
| Events in quadrant A | 7,563,156 | 7,719,209 |
| Events in quadrant B | 7,293,970 | 7,788,122 |
| Events in quadrant C | 7,542,042 | 7,295,575 |
| Events in quadrant D | 6,297,256 | 6,386,810 |
| Mode M9 | |||
|---|---|---|---|
| Quadrant | BADHDUFLAG | Total packets | Discarded packets |
| A | 0 | 199 | 0 |
| B | 0 | 200 | 0 |
| C | 0 | 200 | 0 |
| D | 0 | 200 | 0 |
| Mode M0 | |||
|---|---|---|---|
| Quadrant | BADHDUFLAG | Total packets | Discarded packets |
| A | 0 | 454652 | 0 |
| B | 0 | 334319 | 0 |
| C | 0 | 312689 | 0 |
| D | 0 | 426334 | 0 |
| Mode SS | |||
|---|---|---|---|
| Quadrant | BADHDUFLAG | Total packets | Discarded packets |
| A | 0 | 2882 | 0 |
| B | 0 | 2880 | 0 |
| C | 0 | 2883 | 0 |
| D | 0 | 2882 | 0 |
| Quadrant | Total seconds | Saturated seconds | Saturation percentage |
|---|---|---|---|
| A | 141904 | 4207 | 2.964680% |
| B | 141897 | 5823 | 4.103681% |
| C | 141902 | 2672 | 1.882990% |
| D | 141899 | 8945 | 6.303779% |
Noise dominated data is calculated using 1-second bins in cleaned event files. If a bin has >2000 counts, and if more than 50% of those come from <1% of pixels, then it is considered to be noise-dominated and hence unusable.
| Quadrant | # 1 sec bins | Bins with >0 counts | Bins with >2000 counts | High rate bins dominated by noise | Noise dominated (total time) | Noise dominated (detector-on time) | Marked lightcurve |
|---|---|---|---|---|---|---|---|
| A | 191920 | 141979 | 0 | 0 | 0.00% | 0.00% | 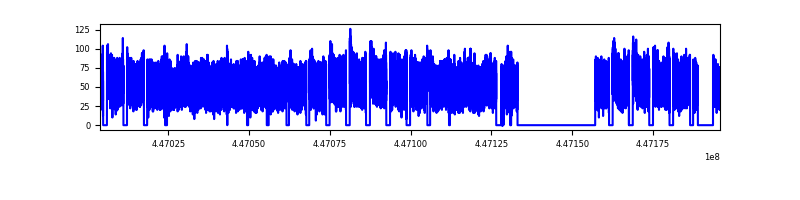 |
| B | 191920 | 141933 | 0 | 0 | 0.00% | 0.00% |  |
| C | 191920 | 141925 | 0 | 0 | 0.00% | 0.00% |  |
| D | 191920 | 141557 | 0 | 0 | 0.00% | 0.00% |  |
Top three noisy pixels from each quadrant. If the there are fewer than three noisy pixels in the level2.evt file, extra rows are filled as -1
| Pixel properties | Quadrant properties | ||||||
|---|---|---|---|---|---|---|---|
| Quadrant | DetID | PixID | Counts | Sigma | Mean | Median | Sigma |
| A | 7 | 110 | 6139 | 8.54 | 1974 | 1845 | 502.6 |
| A | 15 | 236 | 5823 | 7.91 | 1974 | 1845 | 502.6 |
| A | 0 | 29 | 5719 | 7.71 | 1974 | 1845 | 502.6 |
| B | 2 | 9 | 6687 | 13.01 | 1932 | 1845 | 372.1 |
| B | 2 | 8 | 5444 | 9.67 | 1932 | 1845 | 372.1 |
| B | 3 | 17 | 5358 | 9.44 | 1932 | 1845 | 372.1 |
| C | 3 | 202 | 5858 | 7.88 | 1995 | 1857 | 507.6 |
| C | 1 | 81 | 5836 | 7.84 | 1995 | 1857 | 507.6 |
| C | 3 | 203 | 5656 | 7.48 | 1995 | 1857 | 507.6 |
| D | 12 | 6 | 4781 | 6.27 | 1813 | 1647 | 499.7 |
| D | 10 | 189 | 4547 | 5.8 | 1813 | 1647 | 499.7 |
| D | 4 | 12 | 4542 | 5.79 | 1813 | 1647 | 499.7 |
Histogram calculated using DETX and DETY for each event in the final _common_clean file
| Quadrant A |  |
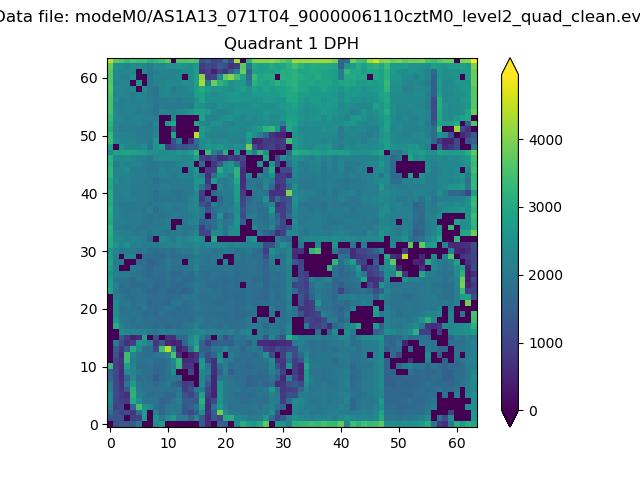 |
Quadrant B |
|---|---|---|---|
| Quadrant D |  |
 |
Quadrant C |
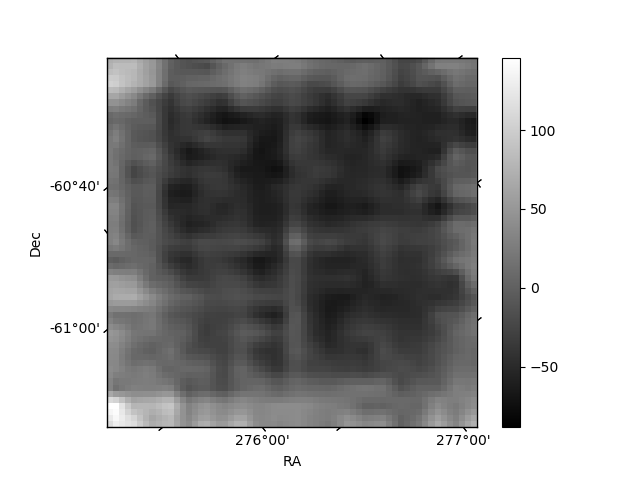
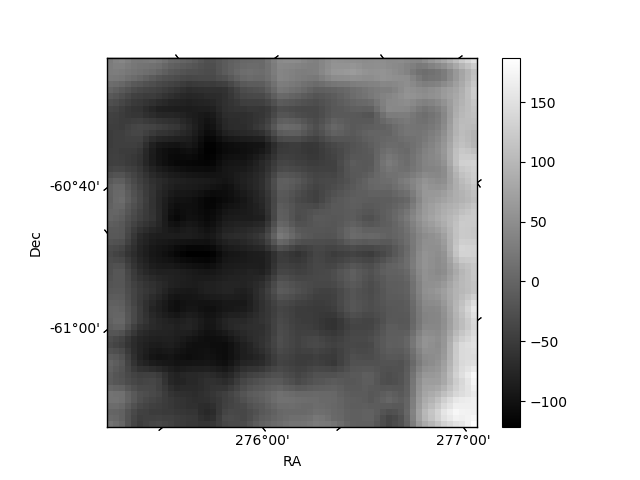
| Plot type | Count rate plots | Images |
|---|---|---|
| Comparison with Poisson distribution Blue bars denote a histogram of data divided into 1 sec bins. Red curve is a Poisson curve with rate = median count rate of data. |
 |
 |
| Quadrant-wise count rates Data is divided into 100 sec bins |
 |
|
| Module-wise count rates for Quadrant A Data is divided into 100 sec bins |
 |
 |
| Module-wise count rates for Quadrant B Data is divided into 100 sec bins |
 |
 |
| Module-wise count rates for Quadrant C Data is divided into 100 sec bins |
 |
 |
| Module-wise count rates for Quadrant D Data is divided into 100 sec bins |
 |
 |
| Parameter | Plot |
|---|---|
| CZT HV Monitor |  |
| D_VDD | 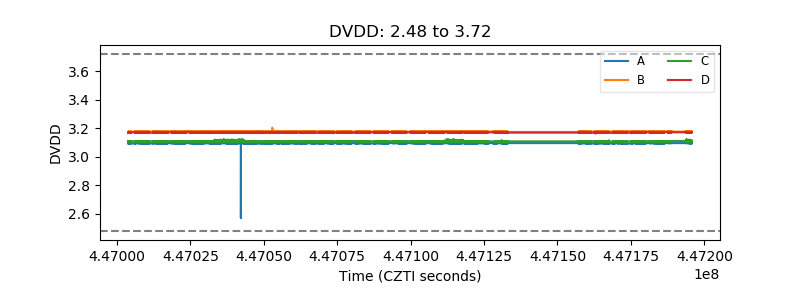 |
| Temperature 1 |  |
| Veto HV Monitor |  |
| Veto LLD |  |
| Alpha Counter |  |
| _CPM_Rate |  |
| CZT Counter | 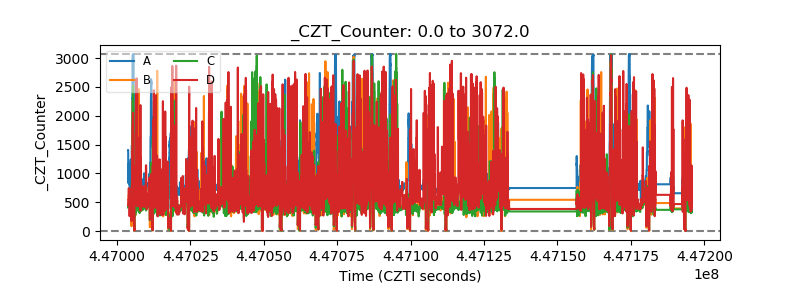 |
| +2.5 Volts monitor |  |
| +5 Volts monitor |  |
| _ROLL_ROT |  |
| _Roll_DEC |  |
| _Roll_RA |  |
| Veto Counter |  |