| Param | Original file | Final file |
|---|---|---|
| Filename | modeM0/AS1A13_093T11_9000006108cztM0_level2.fits | modeM0/AS1A13_093T11_9000006108cztM0_level2_quad_clean.evt |
| Size (bytes) | 506,646,720 | 538,148,160 |
| Size | 483.2 MB | 513.2 MB |
| Events in quadrant A | 2,957,060 | 3,204,014 |
| Events in quadrant B | 2,906,388 | 3,269,523 |
| Events in quadrant C | 2,994,620 | 3,097,308 |
| Events in quadrant D | 2,548,000 | 2,792,346 |
| Mode M9 | |||
|---|---|---|---|
| Quadrant | BADHDUFLAG | Total packets | Discarded packets |
| A | 0 | 58 | 0 |
| B | 0 | 58 | 0 |
| C | 0 | 58 | 0 |
| D | 0 | 58 | 0 |
| Mode M0 | |||
|---|---|---|---|
| Quadrant | BADHDUFLAG | Total packets | Discarded packets |
| A | 0 | 186018 | 0 |
| B | 0 | 125857 | 0 |
| C | 0 | 136179 | 0 |
| D | 0 | 154064 | 0 |
| Mode SS | |||
|---|---|---|---|
| Quadrant | BADHDUFLAG | Total packets | Discarded packets |
| A | 0 | 1166 | 0 |
| B | 0 | 1166 | 0 |
| C | 0 | 1164 | 0 |
| D | 0 | 1166 | 0 |
| Quadrant | Total seconds | Saturated seconds | Saturation percentage |
|---|---|---|---|
| A | 57347 | 1994 | 3.477078% |
| B | 57350 | 1395 | 2.432432% |
| C | 57345 | 1857 | 3.238295% |
| D | 57342 | 3152 | 5.496844% |
Noise dominated data is calculated using 1-second bins in cleaned event files. If a bin has >2000 counts, and if more than 50% of those come from <1% of pixels, then it is considered to be noise-dominated and hence unusable.
| Quadrant | # 1 sec bins | Bins with >0 counts | Bins with >2000 counts | High rate bins dominated by noise | Noise dominated (total time) | Noise dominated (detector-on time) | Marked lightcurve |
|---|---|---|---|---|---|---|---|
| A | 63273 | 57358 | 0 | 0 | 0.00% | 0.00% |  |
| B | 63273 | 57319 | 0 | 0 | 0.00% | 0.00% | 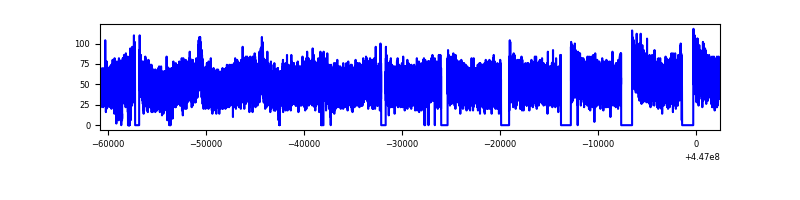 |
| C | 63273 | 57356 | 0 | 0 | 0.00% | 0.00% | 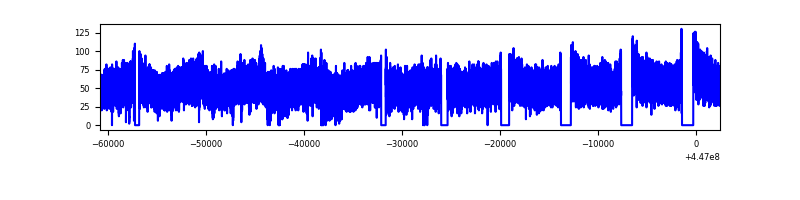 |
| D | 63273 | 57344 | 0 | 0 | 0.00% | 0.00% | 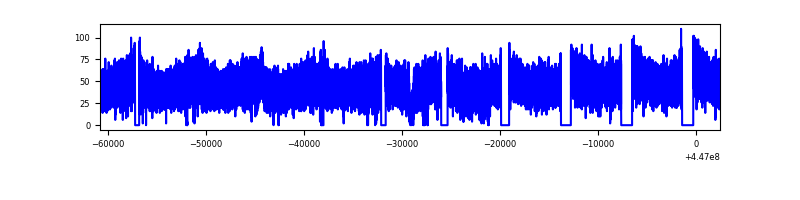 |
Top three noisy pixels from each quadrant. If the there are fewer than three noisy pixels in the level2.evt file, extra rows are filled as -1
| Pixel properties | Quadrant properties | ||||||
|---|---|---|---|---|---|---|---|
| Quadrant | DetID | PixID | Counts | Sigma | Mean | Median | Sigma |
| A | 7 | 110 | 2355 | 8.2 | 770 | 719 | 199.5 |
| A | 15 | 236 | 2337 | 8.11 | 770 | 719 | 199.5 |
| A | 0 | 29 | 2288 | 7.87 | 770 | 719 | 199.5 |
| B | 2 | 9 | 2773 | 13.46 | 765 | 727 | 152.0 |
| B | 3 | 17 | 2157 | 9.41 | 765 | 727 | 152.0 |
| B | 2 | 8 | 2146 | 9.33 | 765 | 727 | 152.0 |
| C | 3 | 202 | 2376 | 8.07 | 790 | 735 | 203.3 |
| C | 3 | 203 | 2331 | 7.85 | 790 | 735 | 203.3 |
| C | 1 | 81 | 2254 | 7.47 | 790 | 735 | 203.3 |
| D | 8 | 176 | 2265 | 7.92 | 730 | 661 | 202.6 |
| D | 4 | 250 | 1964 | 6.43 | 730 | 661 | 202.6 |
| D | 6 | 38 | 1856 | 5.9 | 730 | 661 | 202.6 |
Histogram calculated using DETX and DETY for each event in the final _common_clean file
| Quadrant A | 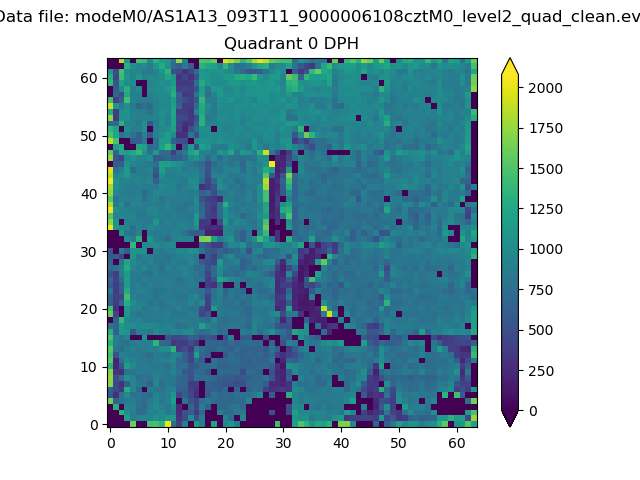 |
 |
Quadrant B |
|---|---|---|---|
| Quadrant D | 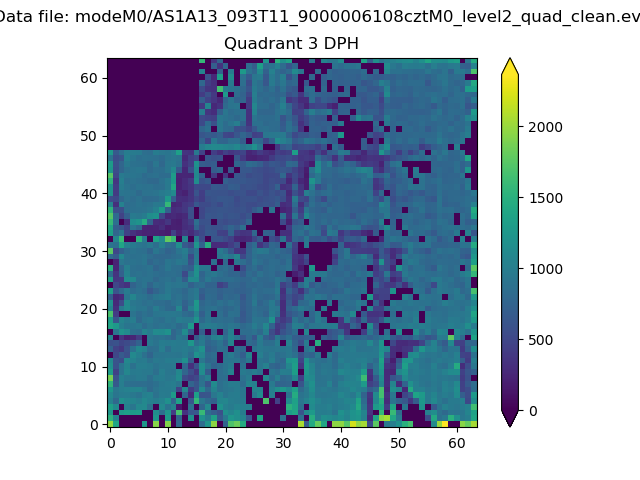 |
 |
Quadrant C |
| Plot type | Count rate plots | Images |
|---|---|---|
| Comparison with Poisson distribution Blue bars denote a histogram of data divided into 1 sec bins. Red curve is a Poisson curve with rate = median count rate of data. |
 |
 |
| Quadrant-wise count rates Data is divided into 100 sec bins |
 |
|
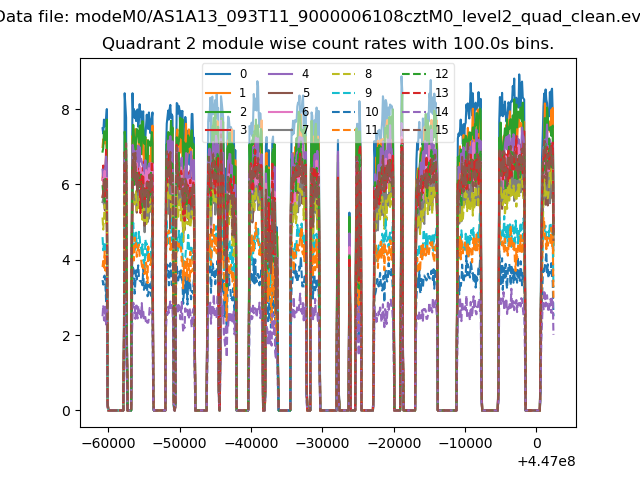
| Module-wise count rates for Quadrant A Data is divided into 100 sec bins |
 |
 |
| Module-wise count rates for Quadrant B Data is divided into 100 sec bins |
 |
 |
| Module-wise count rates for Quadrant C Data is divided into 100 sec bins |
 |
 |
| Module-wise count rates for Quadrant D Data is divided into 100 sec bins |
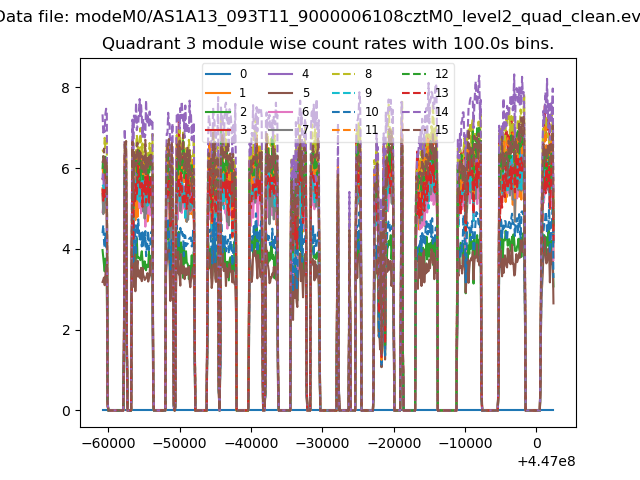 |
 |
| Parameter | Plot |
|---|---|
| CZT HV Monitor |  |
| D_VDD |  |
| Temperature 1 |  |
| Veto HV Monitor | 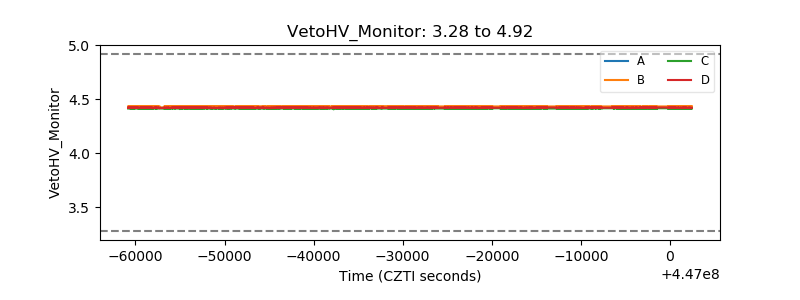 |
| Veto LLD |  |
| Alpha Counter |  |
| _CPM_Rate | 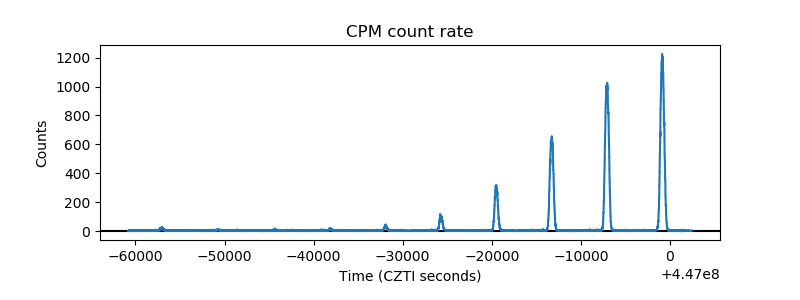 |
| CZT Counter |  |
| +2.5 Volts monitor |  |
| +5 Volts monitor |  |
| _ROLL_ROT |  |
| _Roll_DEC |  |
| _Roll_RA |  |
| Veto Counter |  |