| Param | Original file | Final file |
|---|---|---|
| Filename | modeM0/AS1A13_071T02_9000006106cztM0_level2.fits | modeM0/AS1A13_071T02_9000006106cztM0_level2_quad_clean.evt |
| Size (bytes) | 687,038,400 | 701,700,480 |
| Size | 655.2 MB | 669.2 MB |
| Events in quadrant A | 4,063,222 | 4,162,452 |
| Events in quadrant B | 3,904,750 | 4,139,876 |
| Events in quadrant C | 4,127,042 | 4,077,682 |
| Events in quadrant D | 3,479,736 | 3,643,381 |
| Mode M0 | |||
|---|---|---|---|
| Quadrant | BADHDUFLAG | Total packets | Discarded packets |
| A | 0 | 244494 | 0 |
| B | 0 | 191019 | 0 |
| C | 0 | 169281 | 0 |
| D | 0 | 204078 | 0 |
| Mode SS | |||
|---|---|---|---|
| Quadrant | BADHDUFLAG | Total packets | Discarded packets |
| A | 0 | 1540 | 0 |
| B | 0 | 1542 | 0 |
| C | 0 | 1542 | 0 |
| D | 0 | 1540 | 0 |
| Mode M9 | |||
|---|---|---|---|
| Quadrant | BADHDUFLAG | Total packets | Discarded packets |
| A | 0 | 101 | 0 |
| B | 0 | 101 | 0 |
| C | 0 | 100 | 0 |
| D | 0 | 101 | 0 |
| Quadrant | Total seconds | Saturated seconds | Saturation percentage |
|---|---|---|---|
| A | 76263 | 2377 | 3.116846% |
| B | 76267 | 4499 | 5.899013% |
| C | 76268 | 1522 | 1.995594% |
| D | 76269 | 3746 | 4.911563% |
Noise dominated data is calculated using 1-second bins in cleaned event files. If a bin has >2000 counts, and if more than 50% of those come from <1% of pixels, then it is considered to be noise-dominated and hence unusable.
| Quadrant | # 1 sec bins | Bins with >0 counts | Bins with >2000 counts | High rate bins dominated by noise | Noise dominated (total time) | Noise dominated (detector-on time) | Marked lightcurve |
|---|---|---|---|---|---|---|---|
| A | 86139 | 76271 | 0 | 0 | 0.00% | 0.00% |  |
| B | 86139 | 76183 | 0 | 0 | 0.00% | 0.00% |  |
| C | 86139 | 76251 | 0 | 0 | 0.00% | 0.00% |  |
| D | 86139 | 76220 | 0 | 0 | 0.00% | 0.00% |  |
Top three noisy pixels from each quadrant. If the there are fewer than three noisy pixels in the level2.evt file, extra rows are filled as -1
| Pixel properties | Quadrant properties | ||||||
|---|---|---|---|---|---|---|---|
| Quadrant | DetID | PixID | Counts | Sigma | Mean | Median | Sigma |
| A | 7 | 110 | 3357 | 8.71 | 1057 | 982 | 272.7 |
| A | 15 | 236 | 3287 | 8.45 | 1057 | 982 | 272.7 |
| A | 0 | 29 | 3092 | 7.74 | 1057 | 982 | 272.7 |
| B | 2 | 9 | 3695 | 13.23 | 1030 | 974 | 205.6 |
| B | 2 | 8 | 2947 | 9.6 | 1030 | 974 | 205.6 |
| B | 3 | 17 | 2863 | 9.19 | 1030 | 974 | 205.6 |
| C | 3 | 202 | 3033 | 7.16 | 1090 | 1013 | 282.0 |
| C | 1 | 81 | 3015 | 7.1 | 1090 | 1013 | 282.0 |
| C | 1 | 80 | 2968 | 6.93 | 1090 | 1013 | 282.0 |
| D | 8 | 176 | 2925 | 7.25 | 999 | 903 | 278.7 |
| D | 10 | 113 | 2499 | 5.73 | 999 | 903 | 278.7 |
| D | 10 | 189 | 2483 | 5.67 | 999 | 903 | 278.7 |
Histogram calculated using DETX and DETY for each event in the final _common_clean file
| Quadrant A |  |
 |
Quadrant B |
|---|---|---|---|
| Quadrant D |  |
 |
Quadrant C |
| Plot type | Count rate plots | Images |
|---|---|---|
| Comparison with Poisson distribution Blue bars denote a histogram of data divided into 1 sec bins. Red curve is a Poisson curve with rate = median count rate of data. |
 |
 |
| Quadrant-wise count rates Data is divided into 100 sec bins |
 |
|
| Module-wise count rates for Quadrant A Data is divided into 100 sec bins |
 |
 |
| Module-wise count rates for Quadrant B Data is divided into 100 sec bins |
 |
 |
| Module-wise count rates for Quadrant C Data is divided into 100 sec bins |
 |
 |
| Module-wise count rates for Quadrant D Data is divided into 100 sec bins |
 |
 |
| Parameter | Plot |
|---|---|
| CZT HV Monitor |  |
| D_VDD |  |
| Temperature 1 |  |
| Veto HV Monitor |  |
| Veto LLD |  |
| Alpha Counter |  |
| _CPM_Rate | 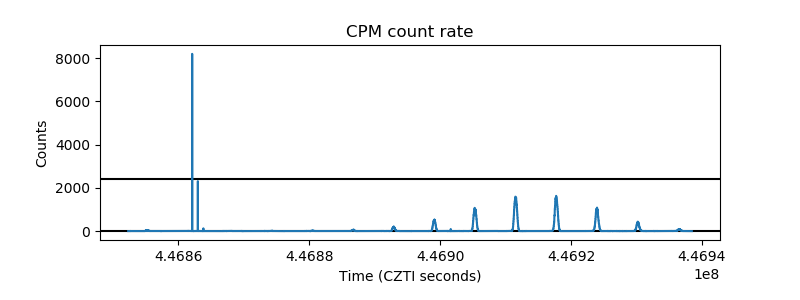 |
| CZT Counter |  |
| +2.5 Volts monitor |  |
| +5 Volts monitor |  |
| _ROLL_ROT |  |
| _Roll_DEC |  |
| _Roll_RA |  |
| Veto Counter |  |