| Param | Original file | Final file |
|---|---|---|
| Filename | modeM0/AS1C02_002T01_9000006092cztM0_level2.fits | modeM0/AS1C02_002T01_9000006092cztM0_level2_quad_clean.evt |
| Size (bytes) | 132,292,800 | 103,512,960 |
| Size | 126.2 MB | 98.7 MB |
| Events in quadrant A | 777,282 | 555,163 |
| Events in quadrant B | 763,684 | 555,232 |
| Events in quadrant C | 795,086 | 541,392 |
| Events in quadrant D | 671,196 | 482,814 |
| Mode M0 | |||
|---|---|---|---|
| Quadrant | BADHDUFLAG | Total packets | Discarded packets |
| A | 0 | 48503 | 0 |
| B | 0 | 33584 | 0 |
| C | 0 | 30238 | 0 |
| D | 0 | 38971 | 0 |
| Mode M9 | |||
|---|---|---|---|
| Quadrant | BADHDUFLAG | Total packets | Discarded packets |
| A | 0 | 30 | 0 |
| B | 0 | 30 | 0 |
| C | 0 | 30 | 0 |
| D | 0 | 30 | 0 |
| Mode SS | |||
|---|---|---|---|
| Quadrant | BADHDUFLAG | Total packets | Discarded packets |
| A | 0 | 296 | 0 |
| B | 0 | 296 | 0 |
| C | 0 | 296 | 0 |
| D | 0 | 296 | 0 |
| Quadrant | Total seconds | Saturated seconds | Saturation percentage |
|---|---|---|---|
| A | 14469 | 559 | 3.863432% |
| B | 14470 | 419 | 2.895646% |
| C | 14469 | 86 | 0.594374% |
| D | 14469 | 344 | 2.377497% |
Noise dominated data is calculated using 1-second bins in cleaned event files. If a bin has >2000 counts, and if more than 50% of those come from <1% of pixels, then it is considered to be noise-dominated and hence unusable.
| Quadrant | # 1 sec bins | Bins with >0 counts | Bins with >2000 counts | High rate bins dominated by noise | Noise dominated (total time) | Noise dominated (detector-on time) | Marked lightcurve |
|---|---|---|---|---|---|---|---|
| A | 22102 | 14470 | 0 | 0 | 0.00% | 0.00% |  |
| B | 22102 | 14470 | 0 | 0 | 0.00% | 0.00% |  |
| C | 22100 | 14468 | 0 | 0 | 0.00% | 0.00% |  |
| D | 22101 | 14469 | 0 | 0 | 0.00% | 0.00% |  |
Top three noisy pixels from each quadrant. If the there are fewer than three noisy pixels in the level2.evt file, extra rows are filled as -1
| Pixel properties | Quadrant properties | ||||||
|---|---|---|---|---|---|---|---|
| Quadrant | DetID | PixID | Counts | Sigma | Mean | Median | Sigma |
| A | 7 | 110 | 631 | 8.35 | 202 | 190 | 52.8 |
| A | 14 | 95 | 613 | 8.01 | 202 | 190 | 52.8 |
| A | 15 | 236 | 606 | 7.88 | 202 | 190 | 52.8 |
| B | 2 | 9 | 668 | 11.28 | 202 | 192 | 42.2 |
| B | 5 | 128 | 575 | 9.07 | 202 | 192 | 42.2 |
| B | 2 | 8 | 572 | 9.0 | 202 | 192 | 42.2 |
| C | 1 | 81 | 616 | 7.59 | 209 | 194 | 55.6 |
| C | 3 | 202 | 593 | 7.18 | 209 | 194 | 55.6 |
| C | 3 | 203 | 583 | 7.0 | 209 | 194 | 55.6 |
| D | 3 | 14 | 533 | 6.56 | 192 | 175 | 54.6 |
| D | 10 | 189 | 490 | 5.77 | 192 | 175 | 54.6 |
| D | 4 | 16 | 486 | 5.7 | 192 | 175 | 54.6 |
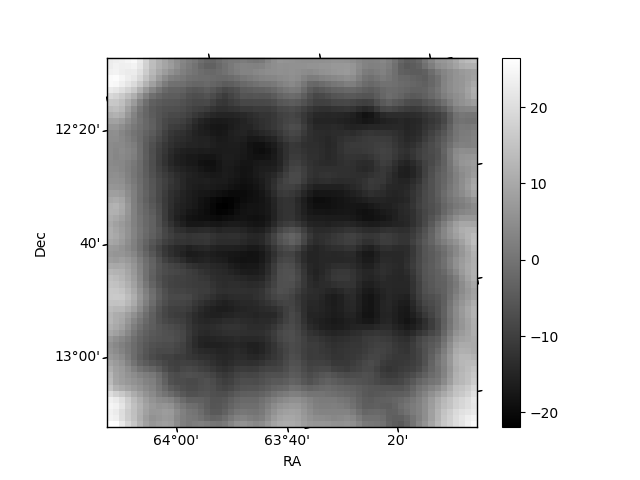
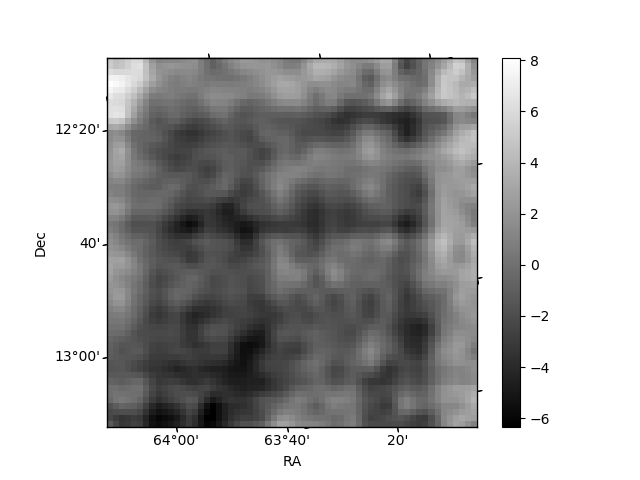
Histogram calculated using DETX and DETY for each event in the final _common_clean file
| Quadrant A |  |
 |
Quadrant B |
|---|---|---|---|
| Quadrant D |  |
 |
Quadrant C |
| Plot type | Count rate plots | Images |
|---|---|---|
| Comparison with Poisson distribution Blue bars denote a histogram of data divided into 1 sec bins. Red curve is a Poisson curve with rate = median count rate of data. |
 |
 |
| Quadrant-wise count rates Data is divided into 100 sec bins |
 |
|
| Module-wise count rates for Quadrant A Data is divided into 100 sec bins |
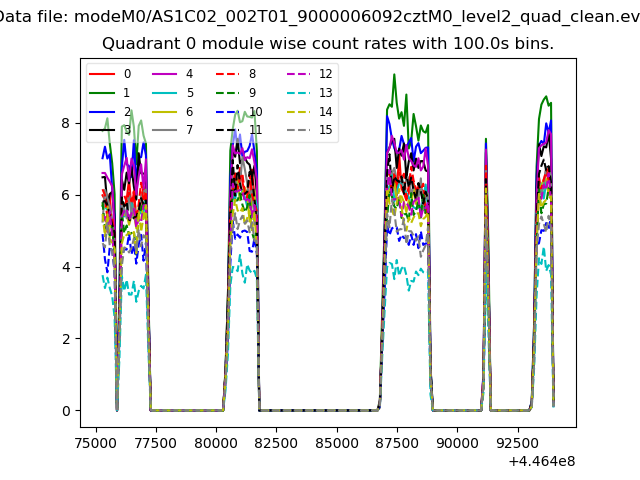 |
 |
| Module-wise count rates for Quadrant B Data is divided into 100 sec bins |
 |
 |
| Module-wise count rates for Quadrant C Data is divided into 100 sec bins |
 |
 |
| Module-wise count rates for Quadrant D Data is divided into 100 sec bins |
 |
 |
| Parameter | Plot |
|---|---|
| CZT HV Monitor |  |
| D_VDD |  |
| Temperature 1 |  |
| Veto HV Monitor |  |
| Veto LLD |  |
| Alpha Counter |  |
| _CPM_Rate |  |
| CZT Counter |  |
| +2.5 Volts monitor |  |
| +5 Volts monitor |  |
| _ROLL_ROT |  |
| _Roll_DEC | 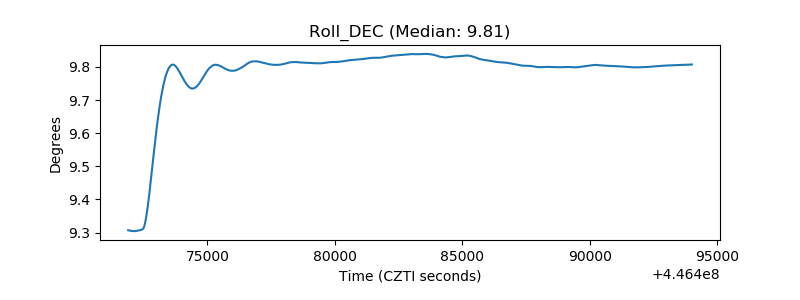 |
| _Roll_RA |  |
| Veto Counter |  |