| Param | Original file | Final file |
|---|---|---|
| Filename | modeM0/AS1A13_042T03_9000006094cztM0_level2.fits | modeM0/AS1A13_042T03_9000006094cztM0_level2_quad_clean.evt |
| Size (bytes) | 240,575,040 | 244,748,160 |
| Size | 229.4 MB | 233.4 MB |
| Events in quadrant A | 1,407,610 | 1,422,603 |
| Events in quadrant B | 1,383,038 | 1,468,059 |
| Events in quadrant C | 1,421,484 | 1,401,258 |
| Events in quadrant D | 1,208,084 | 1,254,712 |
| Mode SS | |||
|---|---|---|---|
| Quadrant | BADHDUFLAG | Total packets | Discarded packets |
| A | 0 | 548 | 0 |
| B | 0 | 548 | 0 |
| C | 0 | 548 | 0 |
| D | 0 | 548 | 0 |
| Mode M9 | |||
|---|---|---|---|
| Quadrant | BADHDUFLAG | Total packets | Discarded packets |
| A | 0 | 21 | 0 |
| B | 0 | 21 | 0 |
| C | 0 | 21 | 0 |
| D | 0 | 21 | 0 |
| Mode M0 | |||
|---|---|---|---|
| Quadrant | BADHDUFLAG | Total packets | Discarded packets |
| A | 0 | 84533 | 0 |
| B | 0 | 58210 | 0 |
| C | 0 | 58603 | 0 |
| D | 0 | 69700 | 0 |
| Quadrant | Total seconds | Saturated seconds | Saturation percentage |
|---|---|---|---|
| A | 27117 | 675 | 2.489213% |
| B | 27117 | 453 | 1.670539% |
| C | 27118 | 384 | 1.416034% |
| D | 27118 | 720 | 2.655063% |
Noise dominated data is calculated using 1-second bins in cleaned event files. If a bin has >2000 counts, and if more than 50% of those come from <1% of pixels, then it is considered to be noise-dominated and hence unusable.
| Quadrant | # 1 sec bins | Bins with >0 counts | Bins with >2000 counts | High rate bins dominated by noise | Noise dominated (total time) | Noise dominated (detector-on time) | Marked lightcurve |
|---|---|---|---|---|---|---|---|
| A | 34306 | 27118 | 0 | 0 | 0.00% | 0.00% |  |
| B | 34306 | 27118 | 0 | 0 | 0.00% | 0.00% |  |
| C | 34307 | 27118 | 0 | 0 | 0.00% | 0.00% |  |
| D | 34307 | 27117 | 0 | 0 | 0.00% | 0.00% |  |
Top three noisy pixels from each quadrant. If the there are fewer than three noisy pixels in the level2.evt file, extra rows are filled as -1
| Pixel properties | Quadrant properties | ||||||
|---|---|---|---|---|---|---|---|
| Quadrant | DetID | PixID | Counts | Sigma | Mean | Median | Sigma |
| A | 7 | 110 | 1185 | 8.87 | 365 | 340 | 95.3 |
| A | 15 | 236 | 1136 | 8.35 | 365 | 340 | 95.3 |
| A | 7 | 109 | 1066 | 7.62 | 365 | 340 | 95.3 |
| B | 2 | 9 | 1321 | 12.92 | 365 | 345 | 75.5 |
| B | 2 | 8 | 1084 | 9.79 | 365 | 345 | 75.5 |
| B | 3 | 17 | 948 | 7.98 | 365 | 345 | 75.5 |
| C | 3 | 202 | 1107 | 7.62 | 375 | 347 | 99.7 |
| C | 1 | 81 | 1094 | 7.49 | 375 | 347 | 99.7 |
| C | 1 | 80 | 1060 | 7.15 | 375 | 347 | 99.7 |
| D | 12 | 6 | 914 | 6.07 | 346 | 314 | 98.9 |
| D | 10 | 113 | 887 | 5.79 | 346 | 314 | 98.9 |
| D | 3 | 31 | 885 | 5.77 | 346 | 314 | 98.9 |
Histogram calculated using DETX and DETY for each event in the final _common_clean file
| Quadrant A |  |
 |
Quadrant B |
|---|---|---|---|
| Quadrant D | 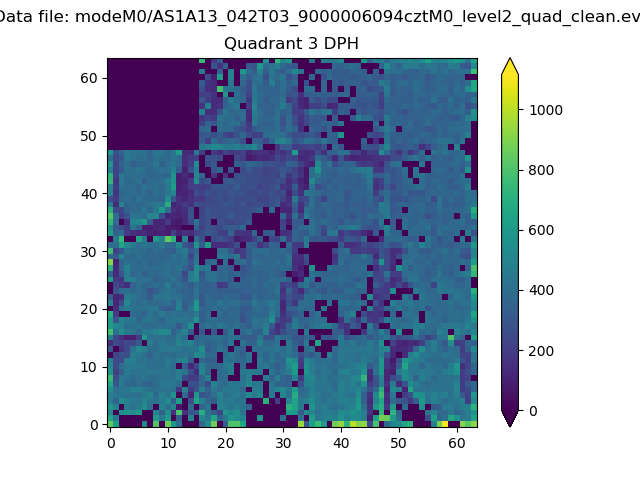 |
 |
Quadrant C |
| Plot type | Count rate plots | Images |
|---|---|---|
| Comparison with Poisson distribution Blue bars denote a histogram of data divided into 1 sec bins. Red curve is a Poisson curve with rate = median count rate of data. |
 |
 |
| Quadrant-wise count rates Data is divided into 100 sec bins |
 |
|
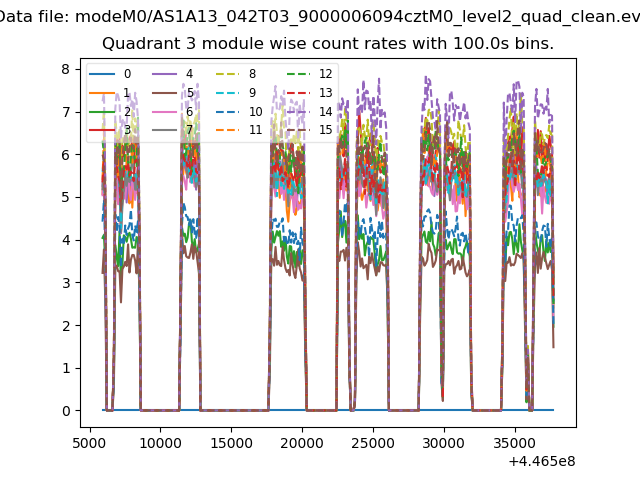
| Module-wise count rates for Quadrant A Data is divided into 100 sec bins |
 |
 |
| Module-wise count rates for Quadrant B Data is divided into 100 sec bins |
 |
 |
| Module-wise count rates for Quadrant C Data is divided into 100 sec bins |
 |
 |
| Module-wise count rates for Quadrant D Data is divided into 100 sec bins |
 |
 |
| Parameter | Plot |
|---|---|
| CZT HV Monitor |  |
| D_VDD |  |
| Temperature 1 |  |
| Veto HV Monitor |  |
| Veto LLD |  |
| Alpha Counter |  |
| _CPM_Rate |  |
| CZT Counter |  |
| +2.5 Volts monitor |  |
| +5 Volts monitor |  |
| _ROLL_ROT |  |
| _Roll_DEC |  |
| _Roll_RA |  |
| Veto Counter |  |