| Param | Original file | Final file |
|---|---|---|
| Filename | modeM0/AS1A13_038T04_9000006090cztM0_level2.fits | modeM0/AS1A13_038T04_9000006090cztM0_level2_quad_clean.evt |
| Size (bytes) | 389,197,440 | 399,268,800 |
| Size | 371.2 MB | 380.8 MB |
| Events in quadrant A | 2,268,616 | 2,328,691 |
| Events in quadrant B | 2,220,390 | 2,381,862 |
| Events in quadrant C | 2,315,148 | 2,308,253 |
| Events in quadrant D | 1,957,440 | 2,049,819 |
| Mode M0 | |||
|---|---|---|---|
| Quadrant | BADHDUFLAG | Total packets | Discarded packets |
| A | 0 | 137155 | 0 |
| B | 0 | 100497 | 0 |
| C | 0 | 92599 | 0 |
| D | 0 | 112243 | 0 |
| Mode M9 | |||
|---|---|---|---|
| Quadrant | BADHDUFLAG | Total packets | Discarded packets |
| A | 0 | 46 | 0 |
| B | 0 | 46 | 0 |
| C | 0 | 46 | 0 |
| D | 0 | 46 | 0 |
| Mode SS | |||
|---|---|---|---|
| Quadrant | BADHDUFLAG | Total packets | Discarded packets |
| A | 0 | 893 | 0 |
| B | 0 | 894 | 0 |
| C | 0 | 896 | 0 |
| D | 0 | 898 | 0 |
| Quadrant | Total seconds | Saturated seconds | Saturation percentage |
|---|---|---|---|
| A | 43929 | 1403 | 3.193790% |
| B | 44045 | 1641 | 3.725735% |
| C | 44078 | 645 | 1.463315% |
| D | 44072 | 1909 | 4.331548% |
Noise dominated data is calculated using 1-second bins in cleaned event files. If a bin has >2000 counts, and if more than 50% of those come from <1% of pixels, then it is considered to be noise-dominated and hence unusable.
| Quadrant | # 1 sec bins | Bins with >0 counts | Bins with >2000 counts | High rate bins dominated by noise | Noise dominated (total time) | Noise dominated (detector-on time) | Marked lightcurve |
|---|---|---|---|---|---|---|---|
| A | 56117 | 44146 | 0 | 0 | 0.00% | 0.00% | 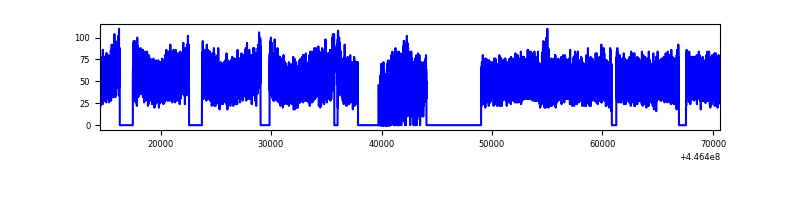 |
| B | 56117 | 44300 | 0 | 0 | 0.00% | 0.00% | 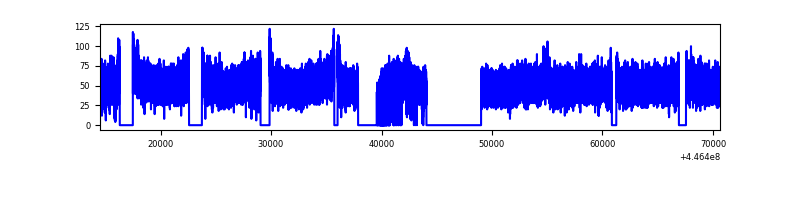 |
| C | 56117 | 44323 | 0 | 0 | 0.00% | 0.00% |  |
| D | 56117 | 44303 | 0 | 0 | 0.00% | 0.00% |  |
Top three noisy pixels from each quadrant. If the there are fewer than three noisy pixels in the level2.evt file, extra rows are filled as -1
| Pixel properties | Quadrant properties | ||||||
|---|---|---|---|---|---|---|---|
| Quadrant | DetID | PixID | Counts | Sigma | Mean | Median | Sigma |
| A | 7 | 110 | 1849 | 8.32 | 592 | 548 | 156.3 |
| A | 0 | 29 | 1758 | 7.74 | 592 | 548 | 156.3 |
| A | 15 | 236 | 1737 | 7.61 | 592 | 548 | 156.3 |
| B | 2 | 9 | 2103 | 13.32 | 586 | 556 | 116.1 |
| B | 2 | 8 | 1692 | 9.78 | 586 | 556 | 116.1 |
| B | 3 | 17 | 1647 | 9.4 | 586 | 556 | 116.1 |
| C | 3 | 202 | 1779 | 7.68 | 612 | 568 | 157.7 |
| C | 3 | 203 | 1736 | 7.41 | 612 | 568 | 157.7 |
| C | 1 | 81 | 1709 | 7.24 | 612 | 568 | 157.7 |
| D | 3 | 14 | 1469 | 6.1 | 561 | 509 | 157.4 |
| D | 6 | 67 | 1409 | 5.72 | 561 | 509 | 157.4 |
| D | 4 | 16 | 1400 | 5.66 | 561 | 509 | 157.4 |
Histogram calculated using DETX and DETY for each event in the final _common_clean file
| Quadrant A |  |
 |
Quadrant B |
|---|---|---|---|
| Quadrant D |  |
 |
Quadrant C |
| Plot type | Count rate plots | Images |
|---|---|---|
| Comparison with Poisson distribution Blue bars denote a histogram of data divided into 1 sec bins. Red curve is a Poisson curve with rate = median count rate of data. |
 |
 |
| Quadrant-wise count rates Data is divided into 100 sec bins |
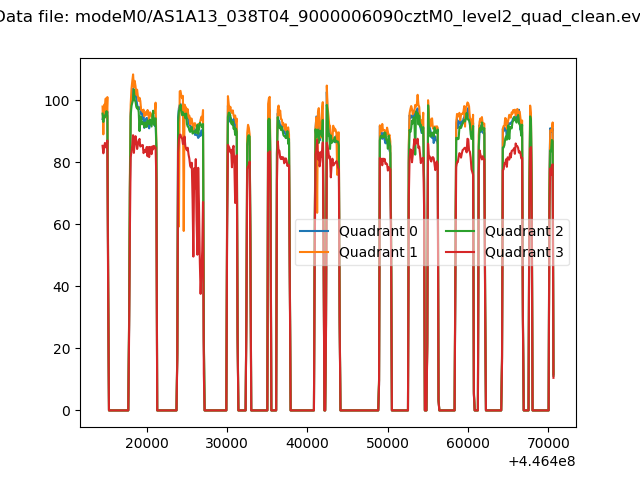 |
|
| Module-wise count rates for Quadrant A Data is divided into 100 sec bins |
 |
 |
| Module-wise count rates for Quadrant B Data is divided into 100 sec bins |
 |
 |
| Module-wise count rates for Quadrant C Data is divided into 100 sec bins |
 |
 |
| Module-wise count rates for Quadrant D Data is divided into 100 sec bins |
 |
 |
| Parameter | Plot |
|---|---|
| CZT HV Monitor | 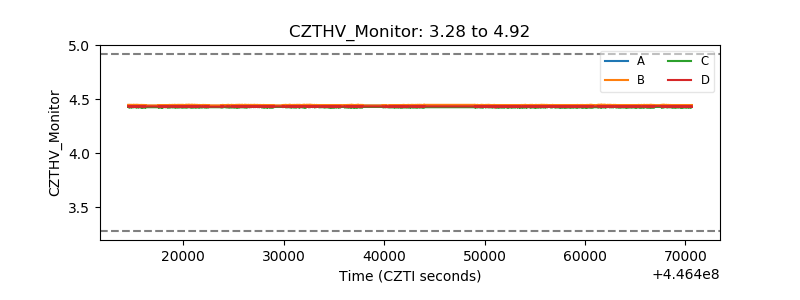 |
| D_VDD |  |
| Temperature 1 |  |
| Veto HV Monitor |  |
| Veto LLD |  |
| Alpha Counter |  |
| _CPM_Rate |  |
| CZT Counter | 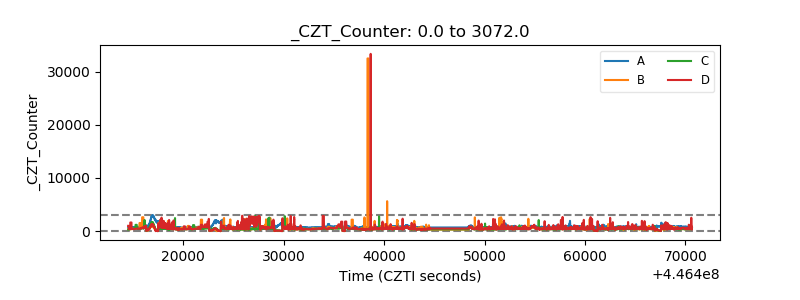 |
| +2.5 Volts monitor |  |
| +5 Volts monitor | 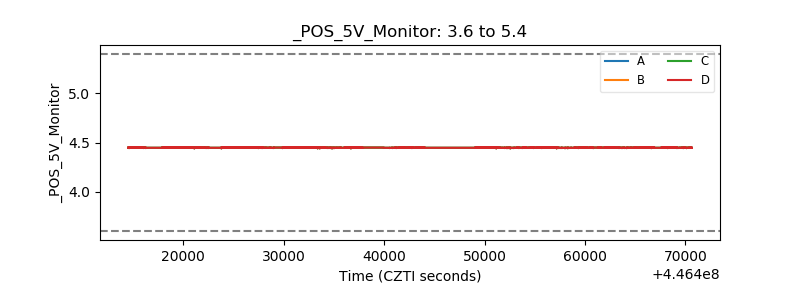 |
| _ROLL_ROT | 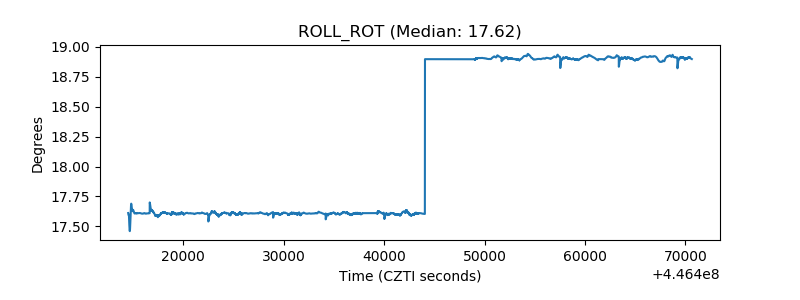 |
| _Roll_DEC |  |
| _Roll_RA |  |
| Veto Counter |  |