| Param | Original file | Final file |
|---|---|---|
| Filename | modeM0/AS1A13_041T15_9000006086cztM0_level2.fits | modeM0/AS1A13_041T15_9000006086cztM0_level2_quad_clean.evt |
| Size (bytes) | 293,512,320 | 310,777,920 |
| Size | 279.9 MB | 296.4 MB |
| Events in quadrant A | 1,706,852 | 1,819,804 |
| Events in quadrant B | 1,672,200 | 1,854,547 |
| Events in quadrant C | 1,743,486 | 1,831,061 |
| Events in quadrant D | 1,463,236 | 1,604,149 |
| Mode M9 | |||
|---|---|---|---|
| Quadrant | BADHDUFLAG | Total packets | Discarded packets |
| A | 0 | 29 | 0 |
| B | 0 | 30 | 0 |
| C | 0 | 30 | 0 |
| D | 0 | 30 | 0 |
| Mode M0 | |||
|---|---|---|---|
| Quadrant | BADHDUFLAG | Total packets | Discarded packets |
| A | 0 | 105700 | 0 |
| B | 0 | 74874 | 0 |
| C | 0 | 73399 | 0 |
| D | 0 | 89985 | 0 |
| Mode SS | |||
|---|---|---|---|
| Quadrant | BADHDUFLAG | Total packets | Discarded packets |
| A | 0 | 678 | 0 |
| B | 0 | 678 | 0 |
| C | 0 | 678 | 0 |
| D | 0 | 676 | 0 |
| Quadrant | Total seconds | Saturated seconds | Saturation percentage |
|---|---|---|---|
| A | 33482 | 939 | 2.804492% |
| B | 33514 | 850 | 2.536254% |
| C | 33511 | 513 | 1.530841% |
| D | 33484 | 1451 | 4.333413% |
Noise dominated data is calculated using 1-second bins in cleaned event files. If a bin has >2000 counts, and if more than 50% of those come from <1% of pixels, then it is considered to be noise-dominated and hence unusable.
| Quadrant | # 1 sec bins | Bins with >0 counts | Bins with >2000 counts | High rate bins dominated by noise | Noise dominated (total time) | Noise dominated (detector-on time) | Marked lightcurve |
|---|---|---|---|---|---|---|---|
| A | 35482 | 33550 | 0 | 0 | 0.00% | 0.00% |  |
| B | 35482 | 33552 | 0 | 0 | 0.00% | 0.00% |  |
| C | 35483 | 33560 | 0 | 0 | 0.00% | 0.00% | 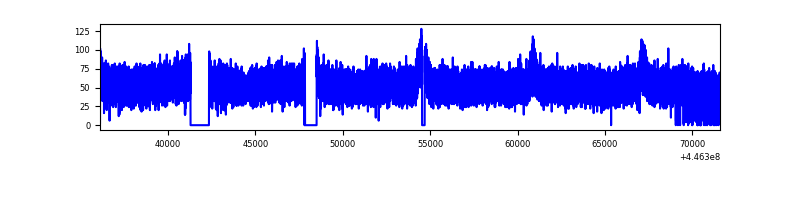 |
| D | 35482 | 33523 | 0 | 0 | 0.00% | 0.00% |  |
Top three noisy pixels from each quadrant. If the there are fewer than three noisy pixels in the level2.evt file, extra rows are filled as -1
| Pixel properties | Quadrant properties | ||||||
|---|---|---|---|---|---|---|---|
| Quadrant | DetID | PixID | Counts | Sigma | Mean | Median | Sigma |
| A | 7 | 110 | 1423 | 8.73 | 444 | 414 | 115.5 |
| A | 15 | 236 | 1350 | 8.1 | 444 | 414 | 115.5 |
| A | 0 | 29 | 1300 | 7.66 | 444 | 414 | 115.5 |
| B | 2 | 9 | 1589 | 13.0 | 442 | 420 | 89.9 |
| B | 2 | 8 | 1278 | 9.55 | 442 | 420 | 89.9 |
| B | 3 | 17 | 1198 | 8.66 | 442 | 420 | 89.9 |
| C | 1 | 81 | 1377 | 7.93 | 460 | 425 | 120.1 |
| C | 3 | 202 | 1319 | 7.44 | 460 | 425 | 120.1 |
| C | 1 | 80 | 1281 | 7.13 | 460 | 425 | 120.1 |
| D | 12 | 6 | 1112 | 6.17 | 420 | 380 | 118.7 |
| D | 10 | 189 | 1107 | 6.12 | 420 | 380 | 118.7 |
| D | 1 | 31 | 1065 | 5.77 | 420 | 380 | 118.7 |
Histogram calculated using DETX and DETY for each event in the final _common_clean file
| Quadrant A | 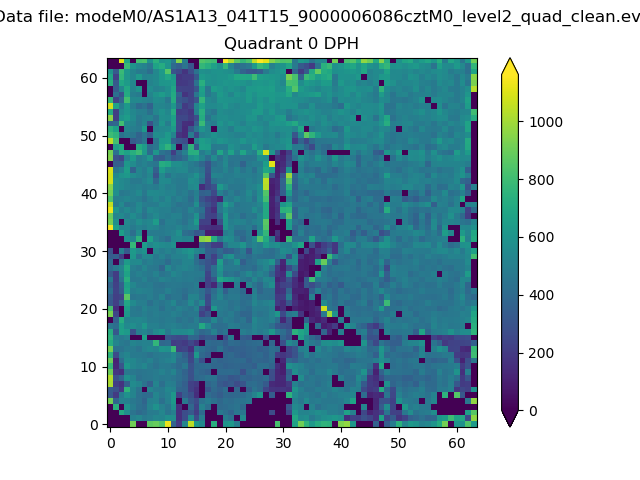 |
 |
Quadrant B |
|---|---|---|---|
| Quadrant D |  |
 |
Quadrant C |
| Plot type | Count rate plots | Images |
|---|---|---|
| Comparison with Poisson distribution Blue bars denote a histogram of data divided into 1 sec bins. Red curve is a Poisson curve with rate = median count rate of data. |
 |
 |
| Quadrant-wise count rates Data is divided into 100 sec bins |
 |
|
| Module-wise count rates for Quadrant A Data is divided into 100 sec bins |
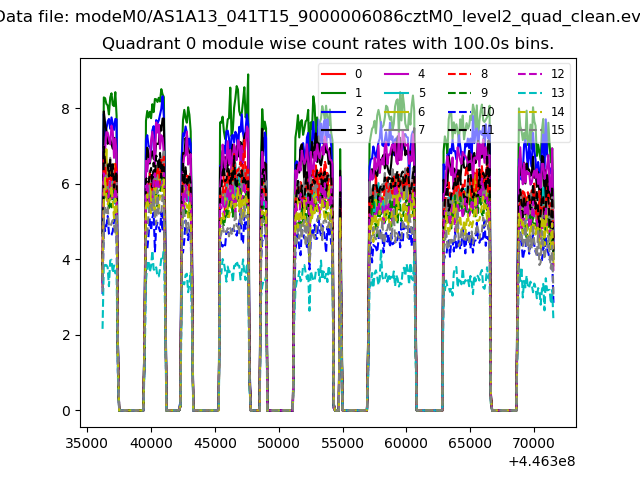 |
 |
| Module-wise count rates for Quadrant B Data is divided into 100 sec bins |
 |
 |
| Module-wise count rates for Quadrant C Data is divided into 100 sec bins |
 |
 |
| Module-wise count rates for Quadrant D Data is divided into 100 sec bins |
 |
 |
| Parameter | Plot |
|---|---|
| CZT HV Monitor |  |
| D_VDD |  |
| Temperature 1 |  |
| Veto HV Monitor | 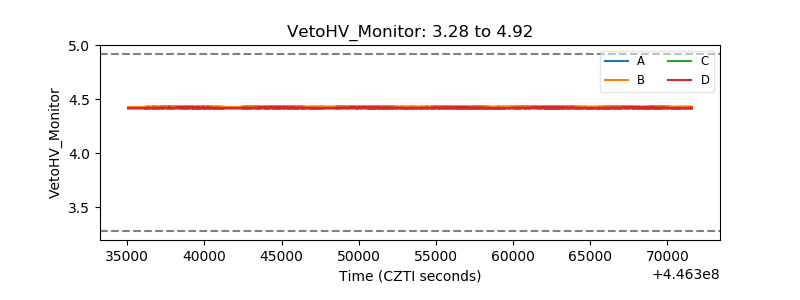 |
| Veto LLD | 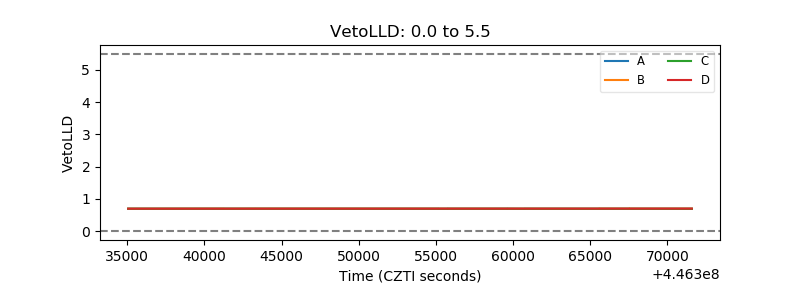 |
| Alpha Counter |  |
| _CPM_Rate | 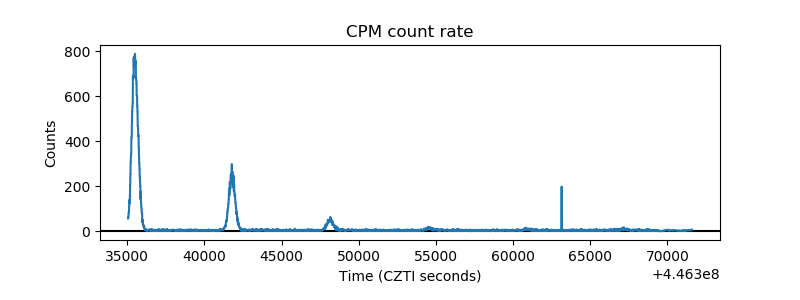 |
| CZT Counter |  |
| +2.5 Volts monitor |  |
| +5 Volts monitor |  |
| _ROLL_ROT |  |
| _Roll_DEC |  |
| _Roll_RA |  |
| Veto Counter |  |