| Param | Original file | Final file |
|---|---|---|
| Filename | modeM0/AS1A13_038T01_9000006076cztM0_level2.fits | modeM0/AS1A13_038T01_9000006076cztM0_level2_quad_clean.evt |
| Size (bytes) | 107,674,560 | 107,769,600 |
| Size | 102.7 MB | 102.8 MB |
| Events in quadrant A | 633,266 | 636,163 |
| Events in quadrant B | 622,838 | 650,062 |
| Events in quadrant C | 644,916 | 617,493 |
| Events in quadrant D | 541,978 | 541,460 |
| Mode M9 | |||
|---|---|---|---|
| Quadrant | BADHDUFLAG | Total packets | Discarded packets |
| A | 0 | 30 | 0 |
| B | 0 | 31 | 0 |
| C | 0 | 31 | 0 |
| D | 0 | 31 | 0 |
| Mode M0 | |||
|---|---|---|---|
| Quadrant | BADHDUFLAG | Total packets | Discarded packets |
| A | 0 | 37830 | 0 |
| B | 0 | 26268 | 0 |
| C | 0 | 25149 | 0 |
| D | 0 | 29955 | 0 |
| Mode SS | |||
|---|---|---|---|
| Quadrant | BADHDUFLAG | Total packets | Discarded packets |
| A | 0 | 240 | 0 |
| B | 0 | 240 | 0 |
| C | 0 | 240 | 0 |
| D | 0 | 240 | 0 |
| Quadrant | Total seconds | Saturated seconds | Saturation percentage |
|---|---|---|---|
| A | 11826 | 261 | 2.207002% |
| B | 11826 | 160 | 1.352951% |
| C | 11826 | 69 | 0.583460% |
| D | 11826 | 274 | 2.316929% |
Noise dominated data is calculated using 1-second bins in cleaned event files. If a bin has >2000 counts, and if more than 50% of those come from <1% of pixels, then it is considered to be noise-dominated and hence unusable.
| Quadrant | # 1 sec bins | Bins with >0 counts | Bins with >2000 counts | High rate bins dominated by noise | Noise dominated (total time) | Noise dominated (detector-on time) | Marked lightcurve |
|---|---|---|---|---|---|---|---|
| A | 13915 | 11823 | 0 | 0 | 0.00% | 0.00% |  |
| B | 13914 | 11822 | 0 | 0 | 0.00% | 0.00% |  |
| C | 13914 | 11823 | 0 | 0 | 0.00% | 0.00% |  |
| D | 13914 | 11820 | 0 | 0 | 0.00% | 0.00% |  |
Top three noisy pixels from each quadrant. If the there are fewer than three noisy pixels in the level2.evt file, extra rows are filled as -1
| Pixel properties | Quadrant properties | ||||||
|---|---|---|---|---|---|---|---|
| Quadrant | DetID | PixID | Counts | Sigma | Mean | Median | Sigma |
| A | 7 | 110 | 498 | 7.92 | 165 | 155 | 43.3 |
| A | 0 | 29 | 497 | 7.89 | 165 | 155 | 43.3 |
| A | 15 | 236 | 489 | 7.71 | 165 | 155 | 43.3 |
| B | 2 | 9 | 625 | 13.45 | 165 | 157 | 34.8 |
| B | 2 | 8 | 491 | 9.6 | 165 | 157 | 34.8 |
| B | 3 | 17 | 456 | 8.59 | 165 | 157 | 34.8 |
| C | 1 | 81 | 527 | 7.95 | 170 | 159 | 46.3 |
| C | 3 | 203 | 493 | 7.21 | 170 | 159 | 46.3 |
| C | 1 | 80 | 471 | 6.74 | 170 | 159 | 46.3 |
| D | 15 | 63 | 420 | 6.25 | 155 | 141 | 44.6 |
| D | 7 | 3 | 402 | 5.85 | 155 | 141 | 44.6 |
| D | 15 | 47 | 401 | 5.83 | 155 | 141 | 44.6 |
Histogram calculated using DETX and DETY for each event in the final _common_clean file
| Quadrant A |  |
 |
Quadrant B |
|---|---|---|---|
| Quadrant D | 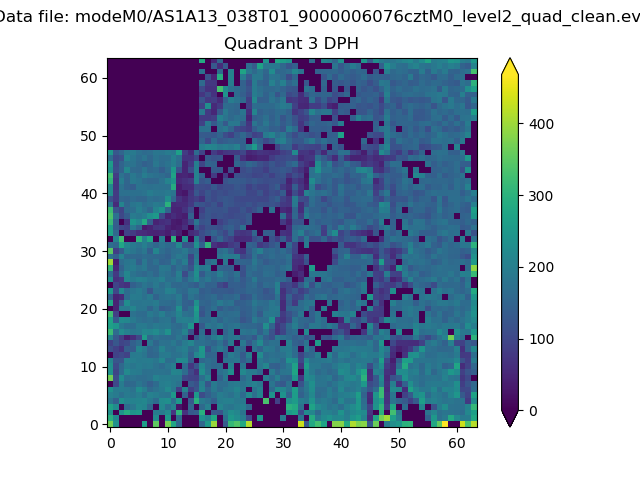 |
 |
Quadrant C |
| Plot type | Count rate plots | Images |
|---|---|---|
| Comparison with Poisson distribution Blue bars denote a histogram of data divided into 1 sec bins. Red curve is a Poisson curve with rate = median count rate of data. |
 |
 |
| Quadrant-wise count rates Data is divided into 100 sec bins |
 |
|
| Module-wise count rates for Quadrant A Data is divided into 100 sec bins |
 |
 |
| Module-wise count rates for Quadrant B Data is divided into 100 sec bins |
 |
 |
| Module-wise count rates for Quadrant C Data is divided into 100 sec bins |
 |
 |
| Module-wise count rates for Quadrant D Data is divided into 100 sec bins |
 |
 |
| Parameter | Plot |
|---|---|
| CZT HV Monitor |  |
| D_VDD |  |
| Temperature 1 |  |
| Veto HV Monitor |  |
| Veto LLD |  |
| Alpha Counter |  |
| _CPM_Rate |  |
| CZT Counter | 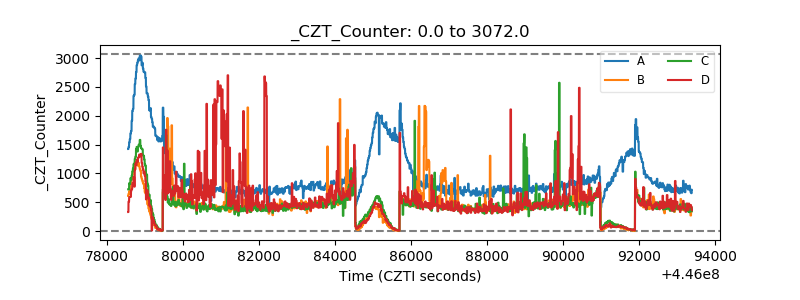 |
| +2.5 Volts monitor |  |
| +5 Volts monitor |  |
| _ROLL_ROT |  |
| _Roll_DEC | 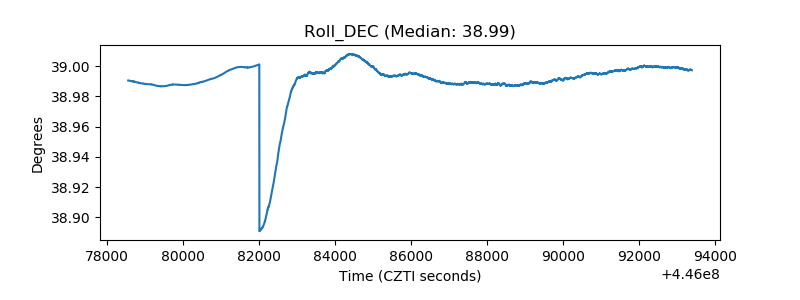 |
| _Roll_RA |  |
| Veto Counter |  |