| Param | Original file | Final file |
|---|---|---|
| Filename | modeM0/AS1A13_024T03_9000006064cztM0_level2.fits | modeM0/AS1A13_024T03_9000006064cztM0_level2_quad_clean.evt |
| Size (bytes) | 1,519,992,000 | 1,629,259,200 |
| Size | 1.4 GB | 1.5 GB |
| Events in quadrant A | 8,988,524 | 9,714,026 |
| Events in quadrant B | 8,771,886 | 10,056,146 |
| Events in quadrant C | 9,092,696 | 9,606,607 |
| Events in quadrant D | 7,398,852 | 8,198,272 |
| Mode M0 | |||
|---|---|---|---|
| Quadrant | BADHDUFLAG | Total packets | Discarded packets |
| A | 0 | 551185 | 0 |
| B | 0 | 383817 | 0 |
| C | 0 | 380521 | 0 |
| D | 0 | 542677 | 0 |
| Mode SS | |||
|---|---|---|---|
| Quadrant | BADHDUFLAG | Total packets | Discarded packets |
| A | 0 | 3478 | 0 |
| B | 0 | 3478 | 0 |
| C | 0 | 3478 | 0 |
| D | 0 | 3478 | 0 |
| Mode M9 | |||
|---|---|---|---|
| Quadrant | BADHDUFLAG | Total packets | Discarded packets |
| A | 0 | 193 | 0 |
| B | 0 | 193 | 0 |
| C | 0 | 193 | 0 |
| D | 0 | 193 | 0 |
| Quadrant | Total seconds | Saturated seconds | Saturation percentage |
|---|---|---|---|
| A | 171807 | 5734 | 3.337466% |
| B | 171809 | 4255 | 2.476587% |
| C | 171809 | 3231 | 1.880577% |
| D | 171806 | 15940 | 9.277906% |
Noise dominated data is calculated using 1-second bins in cleaned event files. If a bin has >2000 counts, and if more than 50% of those come from <1% of pixels, then it is considered to be noise-dominated and hence unusable.
| Quadrant | # 1 sec bins | Bins with >0 counts | Bins with >2000 counts | High rate bins dominated by noise | Noise dominated (total time) | Noise dominated (detector-on time) | Marked lightcurve |
|---|---|---|---|---|---|---|---|
| A | 191044 | 171773 | 0 | 0 | 0.00% | 0.00% |  |
| B | 191043 | 171688 | 0 | 0 | 0.00% | 0.00% |  |
| C | 191044 | 171644 | 0 | 0 | 0.00% | 0.00% | 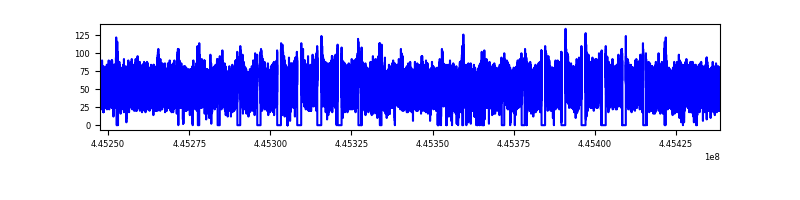 |
| D | 191043 | 171420 | 0 | 0 | 0.00% | 0.00% |  |
Top three noisy pixels from each quadrant. If the there are fewer than three noisy pixels in the level2.evt file, extra rows are filled as -1
| Pixel properties | Quadrant properties | ||||||
|---|---|---|---|---|---|---|---|
| Quadrant | DetID | PixID | Counts | Sigma | Mean | Median | Sigma |
| A | 7 | 110 | 7406 | 8.72 | 2339 | 2178 | 599.2 |
| A | 15 | 236 | 7171 | 8.33 | 2339 | 2178 | 599.2 |
| A | 0 | 29 | 6982 | 8.02 | 2339 | 2178 | 599.2 |
| B | 2 | 9 | 8296 | 13.58 | 2320 | 2204 | 448.5 |
| B | 2 | 8 | 6737 | 10.11 | 2320 | 2204 | 448.5 |
| B | 3 | 17 | 6317 | 9.17 | 2320 | 2204 | 448.5 |
| C | 3 | 202 | 7115 | 7.92 | 2407 | 2239 | 615.5 |
| C | 1 | 81 | 6963 | 7.67 | 2407 | 2239 | 615.5 |
| C | 1 | 80 | 6907 | 7.58 | 2407 | 2239 | 615.5 |
| D | 12 | 6 | 5424 | 5.9 | 2131 | 1932 | 591.8 |
| D | 10 | 189 | 5409 | 5.87 | 2131 | 1932 | 591.8 |
| D | 3 | 14 | 5363 | 5.8 | 2131 | 1932 | 591.8 |
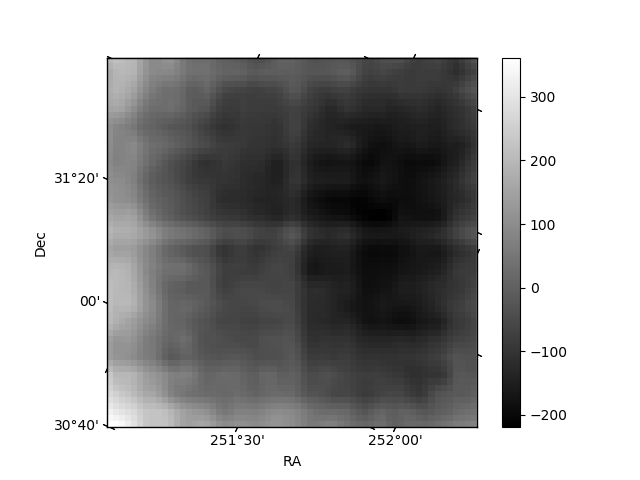
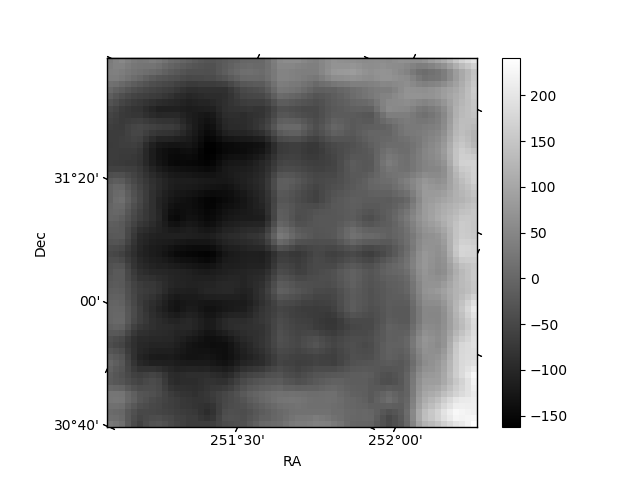
Histogram calculated using DETX and DETY for each event in the final _common_clean file
| Quadrant A |  |
 |
Quadrant B |
|---|---|---|---|
| Quadrant D |  |
 |
Quadrant C |
| Plot type | Count rate plots | Images |
|---|---|---|
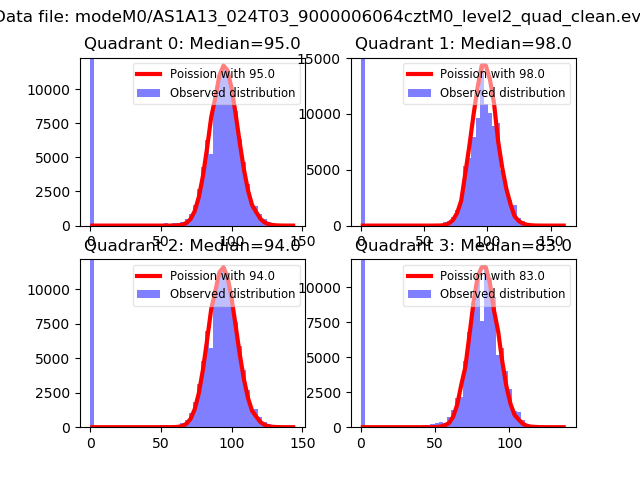
| Comparison with Poisson distribution Blue bars denote a histogram of data divided into 1 sec bins. Red curve is a Poisson curve with rate = median count rate of data. |
 |
 |
| Quadrant-wise count rates Data is divided into 100 sec bins |
 |
|
| Module-wise count rates for Quadrant A Data is divided into 100 sec bins |
 |
 |
| Module-wise count rates for Quadrant B Data is divided into 100 sec bins |
 |
 |
| Module-wise count rates for Quadrant C Data is divided into 100 sec bins |
 |
 |
| Module-wise count rates for Quadrant D Data is divided into 100 sec bins |
 |
 |
| Parameter | Plot |
|---|---|
| CZT HV Monitor | 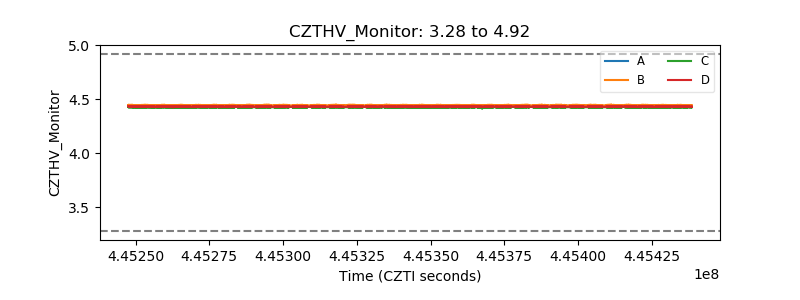 |
| D_VDD | 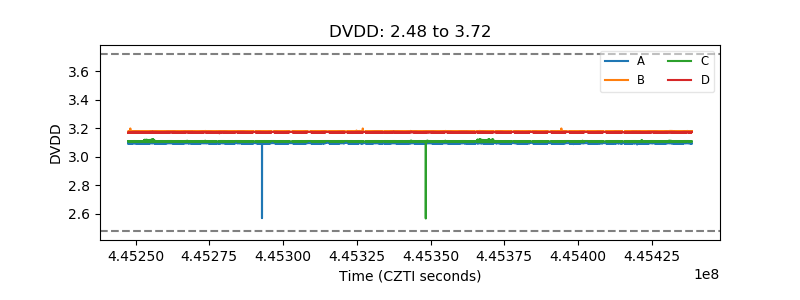 |
| Temperature 1 |  |
| Veto HV Monitor |  |
| Veto LLD | 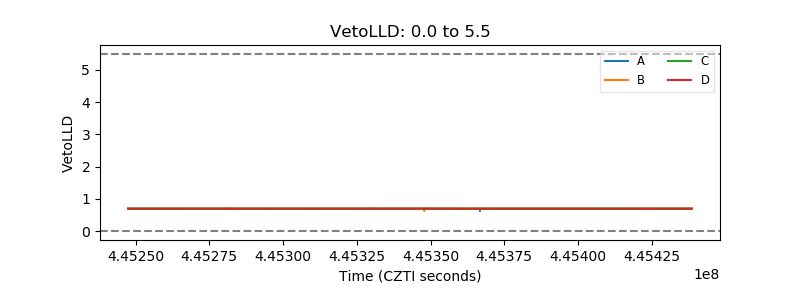 |
| Alpha Counter | 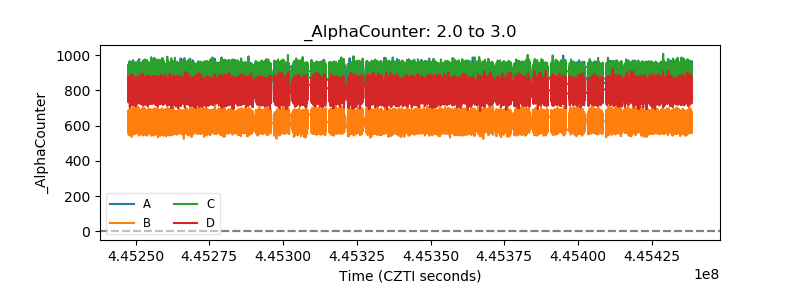 |
| _CPM_Rate | 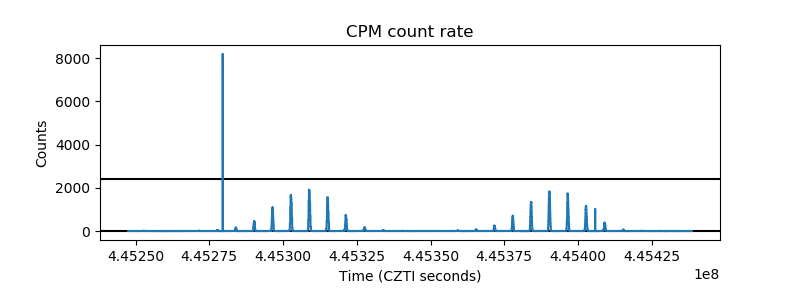 |
| CZT Counter |  |
| +2.5 Volts monitor | 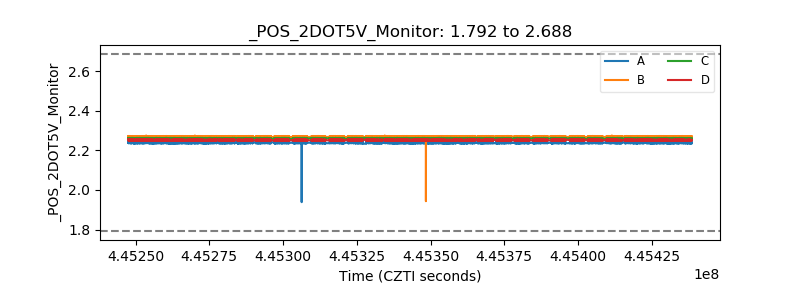 |
| +5 Volts monitor |  |
| _ROLL_ROT |  |
| _Roll_DEC |  |
| _Roll_RA |  |
| Veto Counter |  |