| Param | Original file | Final file |
|---|---|---|
| Filename | modeM0/AS1A13_023T05_9000006062cztM0_level2.fits | modeM0/AS1A13_023T05_9000006062cztM0_level2_quad_clean.evt |
| Size (bytes) | 355,008,960 | 273,833,280 |
| Size | 338.6 MB | 261.1 MB |
| Events in quadrant A | 2,084,744 | 1,443,528 |
| Events in quadrant B | 2,089,740 | 1,543,340 |
| Events in quadrant C | 2,158,088 | 1,453,147 |
| Events in quadrant D | 1,801,996 | 1,235,279 |
| Mode SS | |||
|---|---|---|---|
| Quadrant | BADHDUFLAG | Total packets | Discarded packets |
| A | 0 | 774 | 0 |
| B | 0 | 774 | 0 |
| C | 0 | 774 | 0 |
| D | 0 | 774 | 0 |
| Mode M9 | |||
|---|---|---|---|
| Quadrant | BADHDUFLAG | Total packets | Discarded packets |
| A | 0 | 77 | 0 |
| B | 0 | 77 | 0 |
| C | 0 | 77 | 0 |
| D | 0 | 77 | 0 |
| Mode M0 | |||
|---|---|---|---|
| Quadrant | BADHDUFLAG | Total packets | Discarded packets |
| A | 0 | 125850 | 0 |
| B | 0 | 78958 | 0 |
| C | 0 | 81794 | 0 |
| D | 0 | 108333 | 0 |
| Quadrant | Total seconds | Saturated seconds | Saturation percentage |
|---|---|---|---|
| A | 38095 | 1520 | 3.990025% |
| B | 38095 | 347 | 0.910881% |
| C | 38095 | 394 | 1.034256% |
| D | 38095 | 2104 | 5.523035% |
Noise dominated data is calculated using 1-second bins in cleaned event files. If a bin has >2000 counts, and if more than 50% of those come from <1% of pixels, then it is considered to be noise-dominated and hence unusable.
| Quadrant | # 1 sec bins | Bins with >0 counts | Bins with >2000 counts | High rate bins dominated by noise | Noise dominated (total time) | Noise dominated (detector-on time) | Marked lightcurve |
|---|---|---|---|---|---|---|---|
| A | 45765 | 38078 | 0 | 0 | 0.00% | 0.00% |  |
| B | 45765 | 38093 | 0 | 0 | 0.00% | 0.00% |  |
| C | 45765 | 38091 | 0 | 0 | 0.00% | 0.00% |  |
| D | 45765 | 38076 | 0 | 0 | 0.00% | 0.00% |  |
Top three noisy pixels from each quadrant. If the there are fewer than three noisy pixels in the level2.evt file, extra rows are filled as -1
| Pixel properties | Quadrant properties | ||||||
|---|---|---|---|---|---|---|---|
| Quadrant | DetID | PixID | Counts | Sigma | Mean | Median | Sigma |
| A | 15 | 236 | 1748 | 9.02 | 542 | 508 | 137.5 |
| A | 7 | 110 | 1665 | 8.41 | 542 | 508 | 137.5 |
| A | 0 | 29 | 1601 | 7.95 | 542 | 508 | 137.5 |
| B | 2 | 9 | 1905 | 12.55 | 549 | 521 | 110.3 |
| B | 2 | 8 | 1501 | 8.88 | 549 | 521 | 110.3 |
| B | 3 | 17 | 1484 | 8.73 | 549 | 521 | 110.3 |
| C | 1 | 81 | 1657 | 7.51 | 571 | 531 | 149.8 |
| C | 1 | 80 | 1594 | 7.09 | 571 | 531 | 149.8 |
| C | 3 | 202 | 1530 | 6.67 | 571 | 531 | 149.8 |
| D | 10 | 189 | 1395 | 6.56 | 515 | 469 | 141.1 |
| D | 7 | 3 | 1305 | 5.93 | 515 | 469 | 141.1 |
| D | 6 | 38 | 1298 | 5.88 | 515 | 469 | 141.1 |
Histogram calculated using DETX and DETY for each event in the final _common_clean file
| Quadrant A |  |
 |
Quadrant B |
|---|---|---|---|
| Quadrant D | 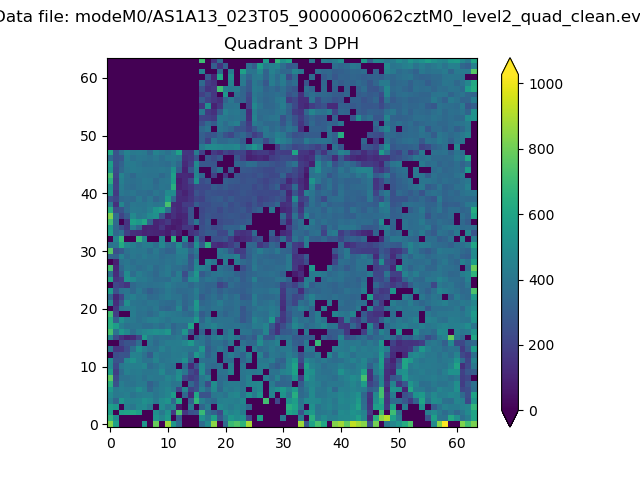 |
 |
Quadrant C |
| Plot type | Count rate plots | Images |
|---|---|---|
| Comparison with Poisson distribution Blue bars denote a histogram of data divided into 1 sec bins. Red curve is a Poisson curve with rate = median count rate of data. |
 |
 |
| Quadrant-wise count rates Data is divided into 100 sec bins |
 |
|
| Module-wise count rates for Quadrant A Data is divided into 100 sec bins |
 |
 |
| Module-wise count rates for Quadrant B Data is divided into 100 sec bins |
 |
 |
| Module-wise count rates for Quadrant C Data is divided into 100 sec bins |
 |
 |
| Module-wise count rates for Quadrant D Data is divided into 100 sec bins |
 |
 |
| Parameter | Plot |
|---|---|
| CZT HV Monitor | 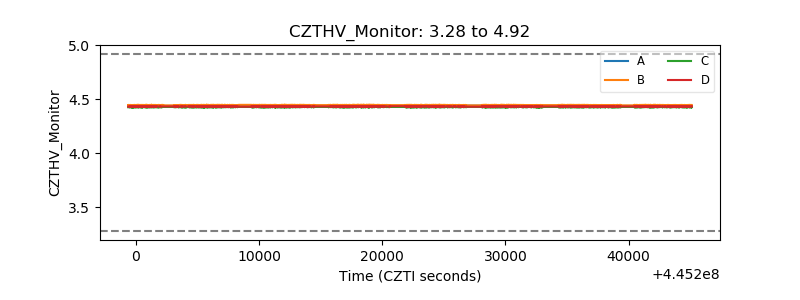 |
| D_VDD |  |
| Temperature 1 |  |
| Veto HV Monitor |  |
| Veto LLD |  |
| Alpha Counter |  |
| _CPM_Rate |  |
| CZT Counter |  |
| +2.5 Volts monitor |  |
| +5 Volts monitor |  |
| _ROLL_ROT |  |
| _Roll_DEC |  |
| _Roll_RA |  |
| Veto Counter |  |