| Param | Original file | Final file |
|---|---|---|
| Filename | modeM0/AS1A13_009T01_9000006060cztM0_level2.fits | modeM0/AS1A13_009T01_9000006060cztM0_level2_quad_clean.evt |
| Size (bytes) | 132,048,000 | 123,212,160 |
| Size | 125.9 MB | 117.5 MB |
| Events in quadrant A | 783,196 | 722,556 |
| Events in quadrant B | 762,826 | 733,808 |
| Events in quadrant C | 791,098 | 714,970 |
| Events in quadrant D | 615,174 | 514,116 |
| Mode SS | |||
|---|---|---|---|
| Quadrant | BADHDUFLAG | Total packets | Discarded packets |
| A | 0 | 308 | 0 |
| B | 0 | 308 | 0 |
| C | 0 | 308 | 0 |
| D | 0 | 308 | 0 |
| Mode M9 | |||
|---|---|---|---|
| Quadrant | BADHDUFLAG | Total packets | Discarded packets |
| A | 0 | 10 | 0 |
| B | 0 | 10 | 0 |
| C | 0 | 10 | 0 |
| D | 0 | 10 | 0 |
| Mode M0 | |||
|---|---|---|---|
| Quadrant | BADHDUFLAG | Total packets | Discarded packets |
| A | 0 | 48773 | 0 |
| B | 0 | 33753 | 0 |
| C | 0 | 33806 | 0 |
| D | 0 | 61050 | 0 |
| Quadrant | Total seconds | Saturated seconds | Saturation percentage |
|---|---|---|---|
| A | 15139 | 606 | 4.002906% |
| B | 15138 | 454 | 2.999075% |
| C | 15139 | 336 | 2.219433% |
| D | 15136 | 3021 | 19.959038% |
Noise dominated data is calculated using 1-second bins in cleaned event files. If a bin has >2000 counts, and if more than 50% of those come from <1% of pixels, then it is considered to be noise-dominated and hence unusable.
| Quadrant | # 1 sec bins | Bins with >0 counts | Bins with >2000 counts | High rate bins dominated by noise | Noise dominated (total time) | Noise dominated (detector-on time) | Marked lightcurve |
|---|---|---|---|---|---|---|---|
| A | 27746 | 15135 | 0 | 0 | 0.00% | 0.00% | 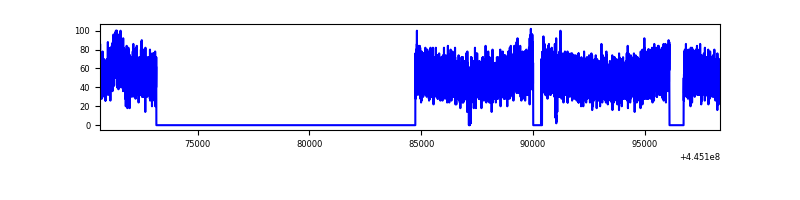 |
| B | 27746 | 15136 | 0 | 0 | 0.00% | 0.00% |  |
| C | 27746 | 15131 | 0 | 0 | 0.00% | 0.00% |  |
| D | 27746 | 15040 | 0 | 0 | 0.00% | 0.00% |  |
Top three noisy pixels from each quadrant. If the there are fewer than three noisy pixels in the level2.evt file, extra rows are filled as -1
| Pixel properties | Quadrant properties | ||||||
|---|---|---|---|---|---|---|---|
| Quadrant | DetID | PixID | Counts | Sigma | Mean | Median | Sigma |
| A | 7 | 110 | 666 | 8.57 | 204 | 190 | 55.5 |
| A | 15 | 236 | 647 | 8.23 | 204 | 190 | 55.5 |
| A | 0 | 29 | 628 | 7.89 | 204 | 190 | 55.5 |
| B | 2 | 9 | 757 | 13.02 | 201 | 190 | 43.5 |
| B | 2 | 8 | 611 | 9.67 | 201 | 190 | 43.5 |
| B | 3 | 17 | 559 | 8.47 | 201 | 190 | 43.5 |
| C | 1 | 81 | 630 | 7.88 | 209 | 193 | 55.4 |
| C | 1 | 80 | 589 | 7.14 | 209 | 193 | 55.4 |
| C | 3 | 158 | 527 | 6.03 | 209 | 193 | 55.4 |
| D | 15 | 47 | 469 | 6.13 | 176 | 160 | 50.4 |
| D | 4 | 12 | 451 | 5.77 | 176 | 160 | 50.4 |
| D | 7 | 3 | 447 | 5.7 | 176 | 160 | 50.4 |
Histogram calculated using DETX and DETY for each event in the final _common_clean file
| Quadrant A |  |
 |
Quadrant B |
|---|---|---|---|
| Quadrant D |  |
 |
Quadrant C |
| Plot type | Count rate plots | Images |
|---|---|---|
| Comparison with Poisson distribution Blue bars denote a histogram of data divided into 1 sec bins. Red curve is a Poisson curve with rate = median count rate of data. |
 |
 |
| Quadrant-wise count rates Data is divided into 100 sec bins |
 |
|
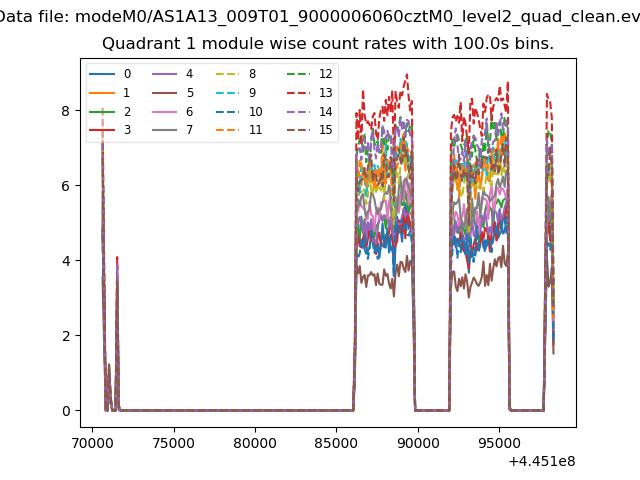
| Module-wise count rates for Quadrant A Data is divided into 100 sec bins |
 |
 |
| Module-wise count rates for Quadrant B Data is divided into 100 sec bins |
 |
 |
| Module-wise count rates for Quadrant C Data is divided into 100 sec bins |
 |
 |
| Module-wise count rates for Quadrant D Data is divided into 100 sec bins |
 |
 |
| Parameter | Plot |
|---|---|
| CZT HV Monitor |  |
| D_VDD | 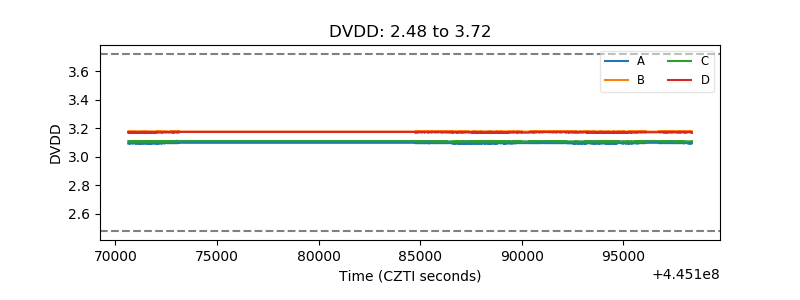 |
| Temperature 1 |  |
| Veto HV Monitor |  |
| Veto LLD |  |
| Alpha Counter | 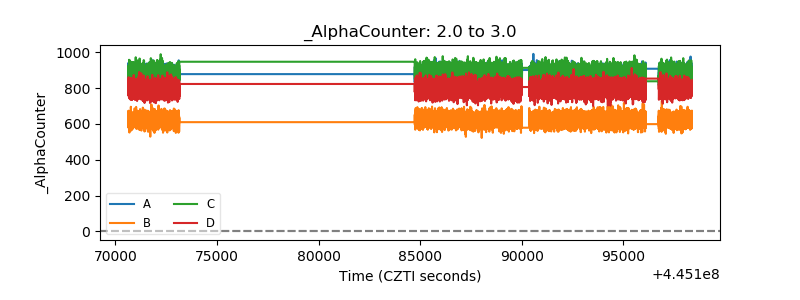 |
| _CPM_Rate |  |
| CZT Counter | 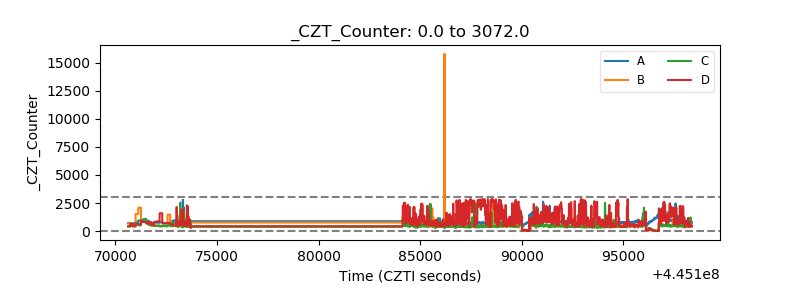 |
| +2.5 Volts monitor | 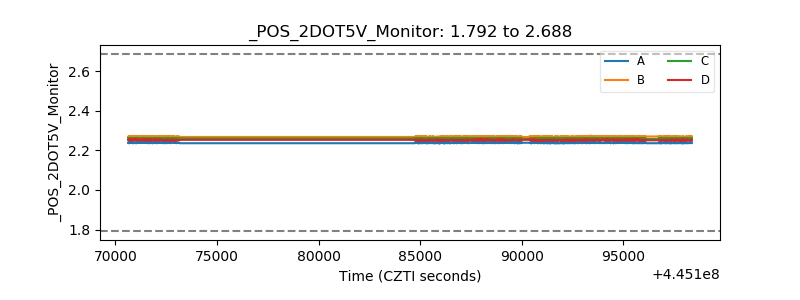 |
| +5 Volts monitor | 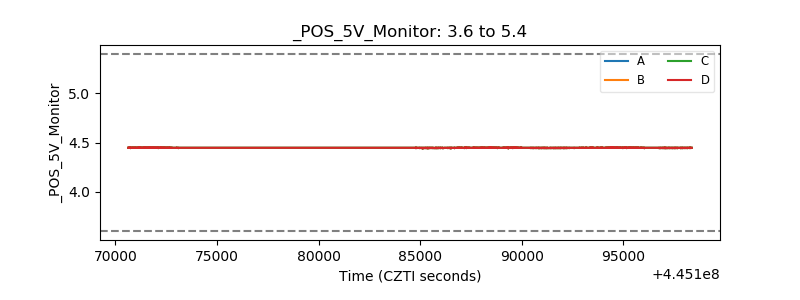 |
| _ROLL_ROT |  |
| _Roll_DEC |  |
| _Roll_RA | 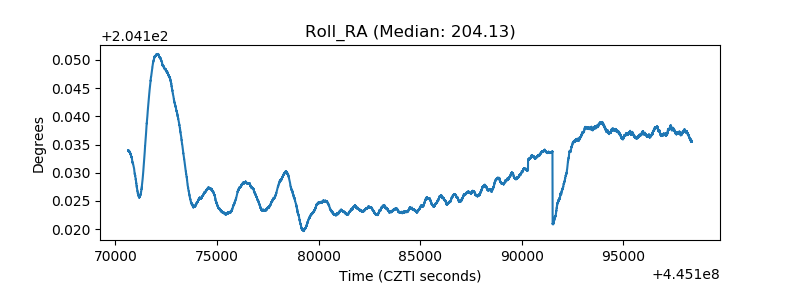 |
| Veto Counter |  |