| Param | Original file | Final file |
|---|---|---|
| Filename | modeM0/AS1A13_038T03_9000006058cztM0_level2.fits | modeM0/AS1A13_038T03_9000006058cztM0_level2_quad_clean.evt |
| Size (bytes) | 588,104,640 | 564,739,200 |
| Size | 560.9 MB | 538.6 MB |
| Events in quadrant A | 3,478,936 | 3,287,589 |
| Events in quadrant B | 3,406,468 | 3,356,912 |
| Events in quadrant C | 3,566,742 | 3,238,366 |
| Events in quadrant D | 2,864,788 | 2,730,361 |
| Mode M0 | |||
|---|---|---|---|
| Quadrant | BADHDUFLAG | Total packets | Discarded packets |
| A | 0 | 208517 | 0 |
| B | 0 | 144259 | 0 |
| C | 0 | 144601 | 0 |
| D | 0 | 215131 | 0 |
| Mode M9 | |||
|---|---|---|---|
| Quadrant | BADHDUFLAG | Total packets | Discarded packets |
| A | 0 | 97 | 0 |
| B | 0 | 97 | 0 |
| C | 0 | 97 | 0 |
| D | 0 | 97 | 0 |
| Mode SS | |||
|---|---|---|---|
| Quadrant | BADHDUFLAG | Total packets | Discarded packets |
| A | 0 | 1336 | 0 |
| B | 0 | 1338 | 0 |
| C | 0 | 1336 | 0 |
| D | 0 | 1338 | 0 |
| Quadrant | Total seconds | Saturated seconds | Saturation percentage |
|---|---|---|---|
| A | 65435 | 1983 | 3.030488% |
| B | 65474 | 1550 | 2.367352% |
| C | 65487 | 1197 | 1.827844% |
| D | 65377 | 7018 | 10.734662% |
Noise dominated data is calculated using 1-second bins in cleaned event files. If a bin has >2000 counts, and if more than 50% of those come from <1% of pixels, then it is considered to be noise-dominated and hence unusable.
| Quadrant | # 1 sec bins | Bins with >0 counts | Bins with >2000 counts | High rate bins dominated by noise | Noise dominated (total time) | Noise dominated (detector-on time) | Marked lightcurve |
|---|---|---|---|---|---|---|---|
| A | 75340 | 65603 | 0 | 0 | 0.00% | 0.00% | 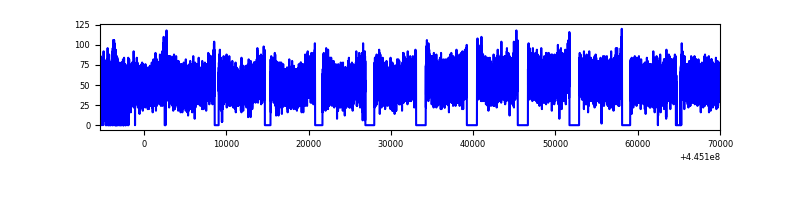 |
| B | 75340 | 65600 | 0 | 0 | 0.00% | 0.00% |  |
| C | 75340 | 65598 | 0 | 0 | 0.00% | 0.00% |  |
| D | 75340 | 65204 | 0 | 0 | 0.00% | 0.00% |  |
Top three noisy pixels from each quadrant. If the there are fewer than three noisy pixels in the level2.evt file, extra rows are filled as -1
| Pixel properties | Quadrant properties | ||||||
|---|---|---|---|---|---|---|---|
| Quadrant | DetID | PixID | Counts | Sigma | Mean | Median | Sigma |
| A | 15 | 236 | 2894 | 8.8 | 906 | 844 | 232.9 |
| A | 7 | 110 | 2834 | 8.54 | 906 | 844 | 232.9 |
| A | 0 | 29 | 2715 | 8.03 | 906 | 844 | 232.9 |
| B | 2 | 9 | 3111 | 12.62 | 900 | 855 | 178.8 |
| B | 2 | 8 | 2516 | 9.29 | 900 | 855 | 178.8 |
| B | 3 | 17 | 2460 | 8.98 | 900 | 855 | 178.8 |
| C | 3 | 203 | 2816 | 7.9 | 942 | 877 | 245.3 |
| C | 3 | 202 | 2814 | 7.9 | 942 | 877 | 245.3 |
| C | 1 | 81 | 2632 | 7.15 | 942 | 877 | 245.3 |
| D | 10 | 189 | 2149 | 6.14 | 823 | 750 | 228.0 |
| D | 12 | 6 | 2070 | 5.79 | 823 | 750 | 228.0 |
| D | 15 | 63 | 2031 | 5.62 | 823 | 750 | 228.0 |
Histogram calculated using DETX and DETY for each event in the final _common_clean file
| Quadrant A | 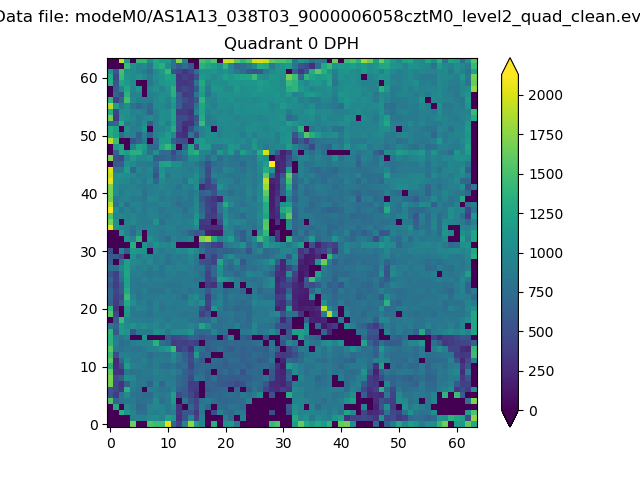 |
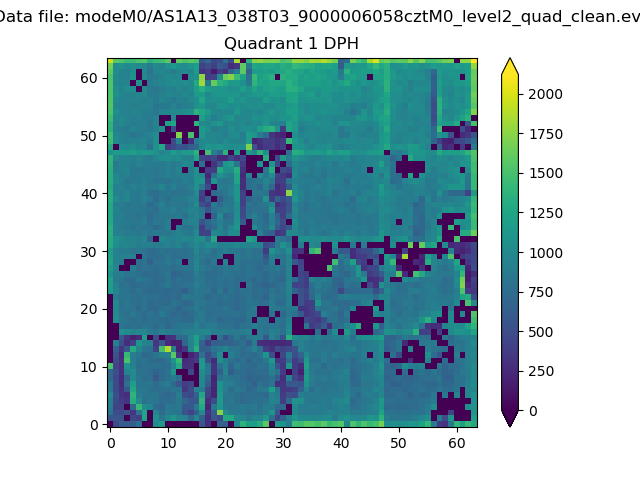 |
Quadrant B |
|---|---|---|---|
| Quadrant D |  |
 |
Quadrant C |
| Plot type | Count rate plots | Images |
|---|---|---|
| Comparison with Poisson distribution Blue bars denote a histogram of data divided into 1 sec bins. Red curve is a Poisson curve with rate = median count rate of data. |
 |
 |
| Quadrant-wise count rates Data is divided into 100 sec bins |
 |
|
| Module-wise count rates for Quadrant A Data is divided into 100 sec bins |
 |
 |
| Module-wise count rates for Quadrant B Data is divided into 100 sec bins |
 |
 |
| Module-wise count rates for Quadrant C Data is divided into 100 sec bins |
 |
 |
| Module-wise count rates for Quadrant D Data is divided into 100 sec bins |
 |
 |
| Parameter | Plot |
|---|---|
| CZT HV Monitor |  |
| D_VDD | 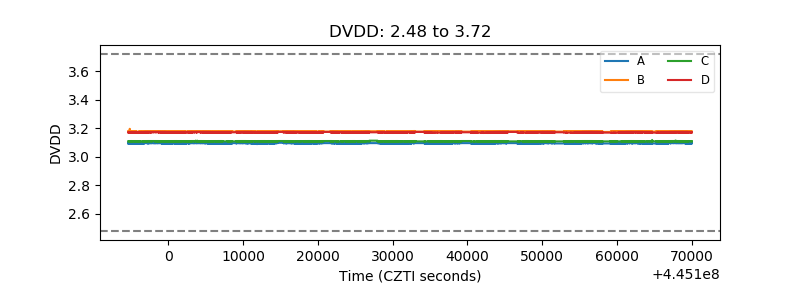 |
| Temperature 1 |  |
| Veto HV Monitor |  |
| Veto LLD |  |
| Alpha Counter |  |
| _CPM_Rate |  |
| CZT Counter |  |
| +2.5 Volts monitor |  |
| +5 Volts monitor | 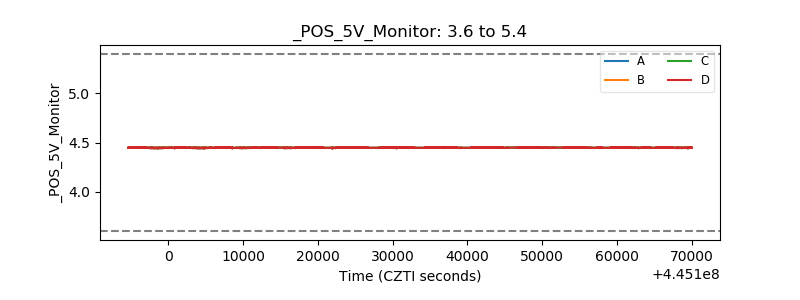 |
| _ROLL_ROT |  |
| _Roll_DEC |  |
| _Roll_RA | 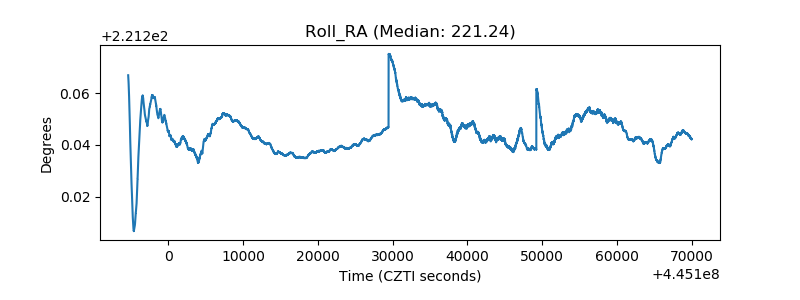 |
| Veto Counter |  |