| Param | Original file | Final file |
|---|---|---|
| Filename | modeM0/AS1A13_049T05_9000006050cztM0_level2.fits | modeM0/AS1A13_049T05_9000006050cztM0_level2_quad_clean.evt |
| Size (bytes) | 955,969,920 | 899,881,920 |
| Size | 911.7 MB | 858.2 MB |
| Events in quadrant A | 5,600,680 | 5,131,668 |
| Events in quadrant B | 5,525,608 | 5,366,210 |
| Events in quadrant C | 5,829,714 | 5,159,266 |
| Events in quadrant D | 4,705,806 | 4,312,336 |
| Mode M0 | |||
|---|---|---|---|
| Quadrant | BADHDUFLAG | Total packets | Discarded packets |
| A | 0 | 348108 | 0 |
| B | 0 | 251044 | 0 |
| C | 0 | 225811 | 0 |
| D | 0 | 345142 | 0 |
| Mode M9 | |||
|---|---|---|---|
| Quadrant | BADHDUFLAG | Total packets | Discarded packets |
| A | 0 | 155 | 0 |
| B | 0 | 155 | 0 |
| C | 0 | 155 | 0 |
| D | 0 | 155 | 0 |
| Mode SS | |||
|---|---|---|---|
| Quadrant | BADHDUFLAG | Total packets | Discarded packets |
| A | 0 | 2162 | 0 |
| B | 0 | 2162 | 0 |
| C | 0 | 2162 | 0 |
| D | 0 | 2162 | 0 |
| Quadrant | Total seconds | Saturated seconds | Saturation percentage |
|---|---|---|---|
| A | 106252 | 4862 | 4.575914% |
| B | 106254 | 2633 | 2.478024% |
| C | 106254 | 1281 | 1.205602% |
| D | 106256 | 10414 | 9.800858% |
Noise dominated data is calculated using 1-second bins in cleaned event files. If a bin has >2000 counts, and if more than 50% of those come from <1% of pixels, then it is considered to be noise-dominated and hence unusable.
| Quadrant | # 1 sec bins | Bins with >0 counts | Bins with >2000 counts | High rate bins dominated by noise | Noise dominated (total time) | Noise dominated (detector-on time) | Marked lightcurve |
|---|---|---|---|---|---|---|---|
| A | 121735 | 106212 | 0 | 0 | 0.00% | 0.00% |  |
| B | 121735 | 106244 | 0 | 0 | 0.00% | 0.00% | 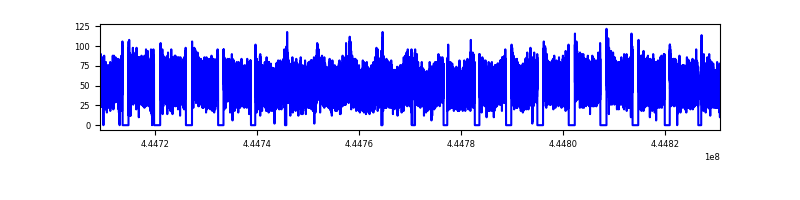 |
| C | 121736 | 106237 | 0 | 0 | 0.00% | 0.00% |  |
| D | 121736 | 106084 | 0 | 0 | 0.00% | 0.00% |  |
Top three noisy pixels from each quadrant. If the there are fewer than three noisy pixels in the level2.evt file, extra rows are filled as -1
| Pixel properties | Quadrant properties | ||||||
|---|---|---|---|---|---|---|---|
| Quadrant | DetID | PixID | Counts | Sigma | Mean | Median | Sigma |
| A | 7 | 110 | 4646 | 8.95 | 1459 | 1358 | 367.3 |
| A | 0 | 29 | 4380 | 8.23 | 1459 | 1358 | 367.3 |
| A | 15 | 236 | 4354 | 8.16 | 1459 | 1358 | 367.3 |
| B | 2 | 9 | 5195 | 13.23 | 1462 | 1389 | 287.6 |
| B | 2 | 8 | 4134 | 9.55 | 1462 | 1389 | 287.6 |
| B | 3 | 17 | 3976 | 9.0 | 1462 | 1389 | 287.6 |
| C | 1 | 81 | 4457 | 7.61 | 1542 | 1433 | 397.5 |
| C | 3 | 202 | 4440 | 7.56 | 1542 | 1433 | 397.5 |
| C | 1 | 80 | 4355 | 7.35 | 1542 | 1433 | 397.5 |
| D | 10 | 189 | 3521 | 6.18 | 1355 | 1233 | 370.2 |
| D | 15 | 47 | 3484 | 6.08 | 1355 | 1233 | 370.2 |
| D | 3 | 14 | 3353 | 5.73 | 1355 | 1233 | 370.2 |
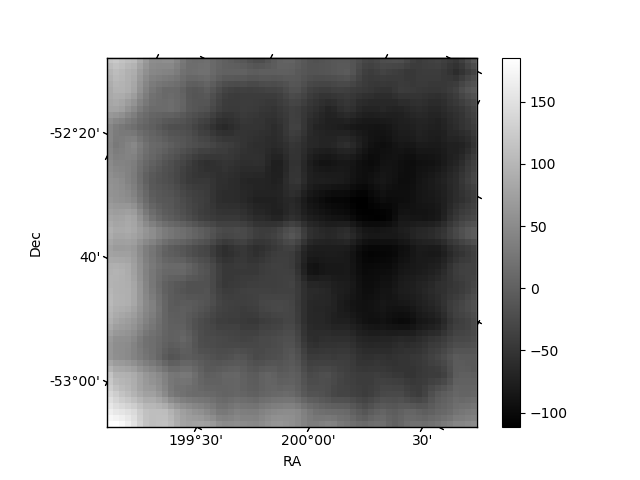
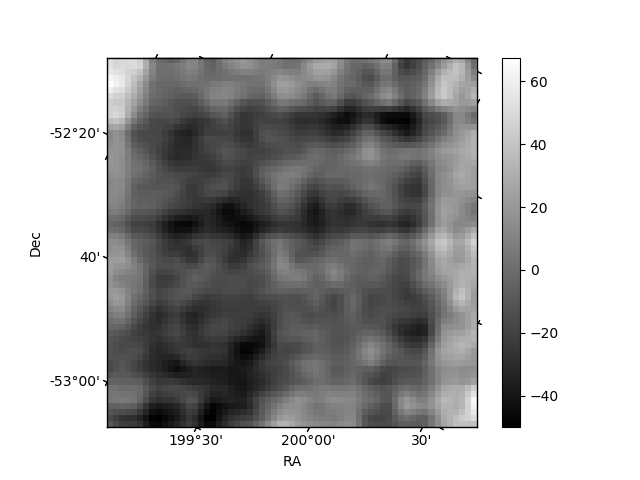
Histogram calculated using DETX and DETY for each event in the final _common_clean file
| Quadrant A |  |
 |
Quadrant B |
|---|---|---|---|
| Quadrant D |  |
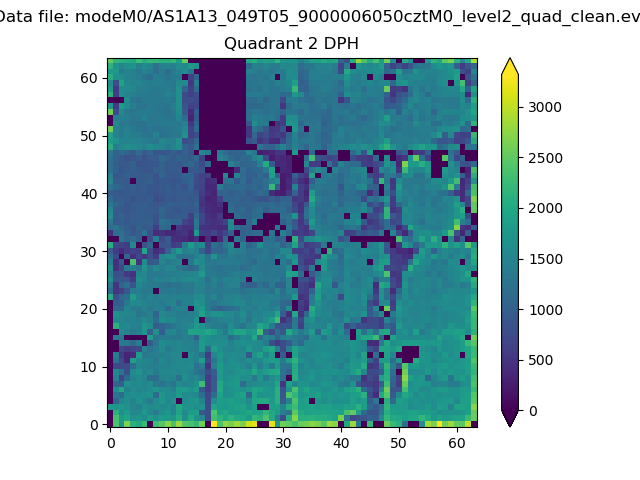 |
Quadrant C |
| Plot type | Count rate plots | Images |
|---|---|---|
| Comparison with Poisson distribution Blue bars denote a histogram of data divided into 1 sec bins. Red curve is a Poisson curve with rate = median count rate of data. |
 |
 |
| Quadrant-wise count rates Data is divided into 100 sec bins |
 |
|
| Module-wise count rates for Quadrant A Data is divided into 100 sec bins |
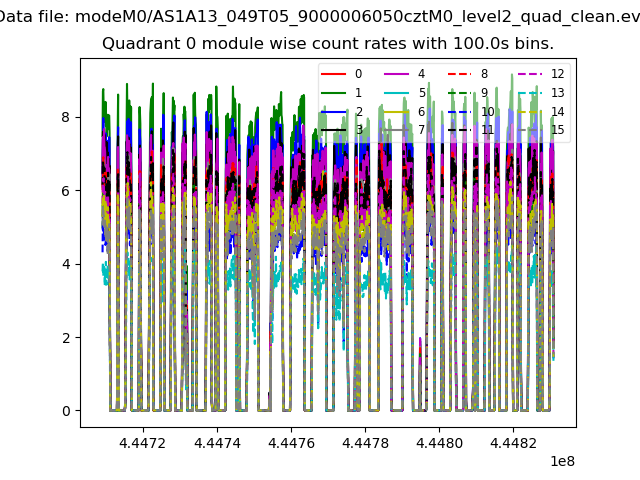 |
 |
| Module-wise count rates for Quadrant B Data is divided into 100 sec bins |
 |
 |
| Module-wise count rates for Quadrant C Data is divided into 100 sec bins |
 |
 |
| Module-wise count rates for Quadrant D Data is divided into 100 sec bins |
 |
 |
| Parameter | Plot |
|---|---|
| CZT HV Monitor |  |
| D_VDD | 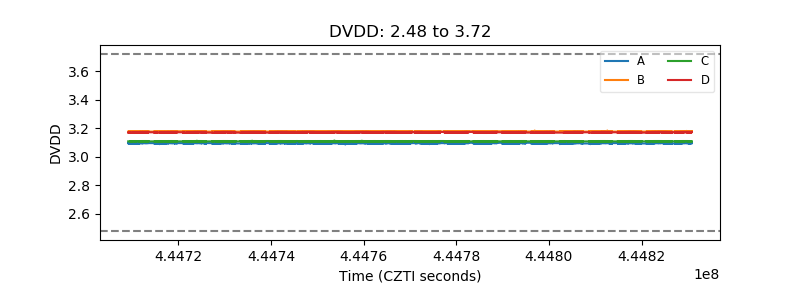 |
| Temperature 1 | 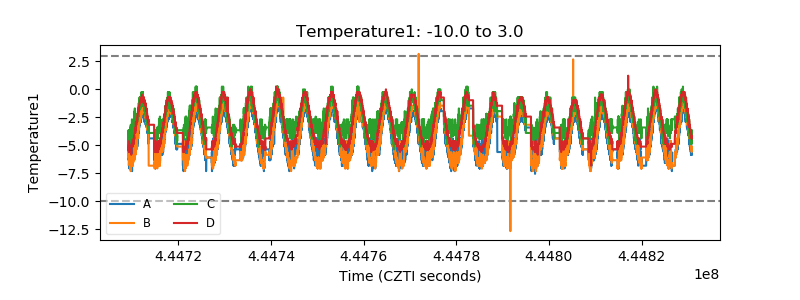 |
| Veto HV Monitor |  |
| Veto LLD | 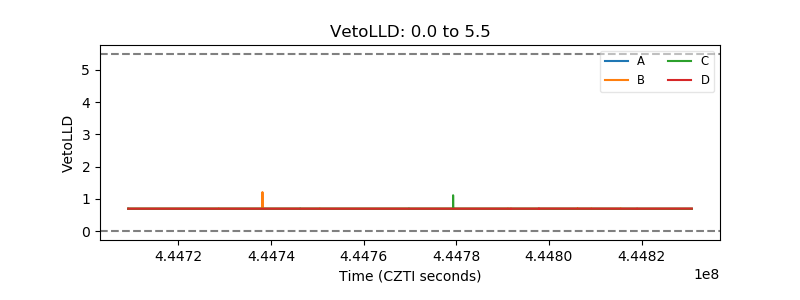 |
| Alpha Counter |  |
| _CPM_Rate |  |
| CZT Counter |  |
| +2.5 Volts monitor | 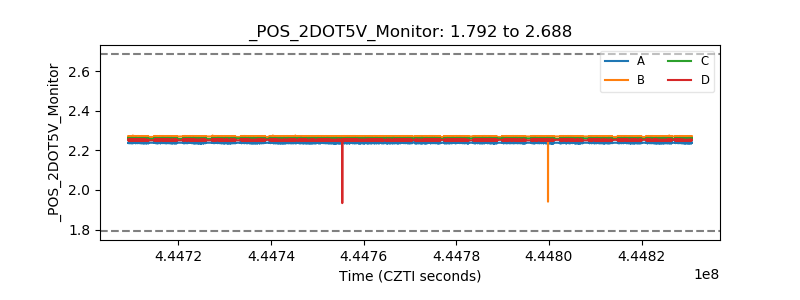 |
| +5 Volts monitor | 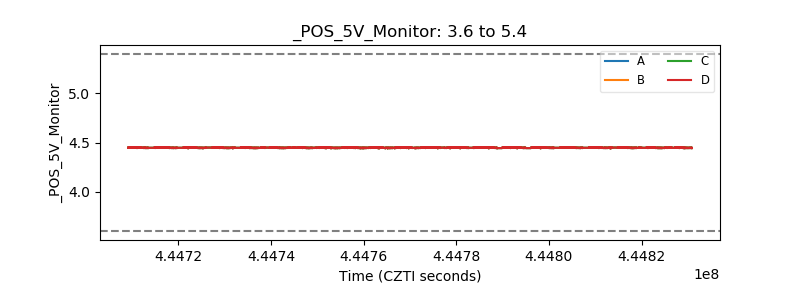 |
| _ROLL_ROT |  |
| _Roll_DEC |  |
| _Roll_RA |  |
| Veto Counter |  |