| Param | Original file | Final file |
|---|---|---|
| Filename | modeM0/AS1A13_049T04_9000006048cztM0_level2.fits | modeM0/AS1A13_049T04_9000006048cztM0_level2_quad_clean.evt |
| Size (bytes) | 773,352,000 | 788,330,880 |
| Size | 737.5 MB | 751.8 MB |
| Events in quadrant A | 3,711,102 | 3,511,668 |
| Events in quadrant B | 4,654,522 | 5,077,708 |
| Events in quadrant C | 4,851,720 | 4,884,322 |
| Events in quadrant D | 3,935,270 | 4,152,498 |
| Mode M9 | |||
|---|---|---|---|
| Quadrant | BADHDUFLAG | Total packets | Discarded packets |
| A | 0 | 109 | 0 |
| B | 0 | 109 | 0 |
| C | 0 | 109 | 0 |
| D | 0 | 109 | 0 |
| Mode M0 | |||
|---|---|---|---|
| Quadrant | BADHDUFLAG | Total packets | Discarded packets |
| A | 0 | 488291 | 0 |
| B | 0 | 203791 | 0 |
| C | 0 | 195027 | 0 |
| D | 0 | 286443 | 0 |
| Mode SS | |||
|---|---|---|---|
| Quadrant | BADHDUFLAG | Total packets | Discarded packets |
| A | 0 | 1848 | 0 |
| B | 0 | 1848 | 0 |
| C | 0 | 1848 | 0 |
| D | 0 | 1846 | 0 |
| Quadrant | Total seconds | Saturated seconds | Saturation percentage |
|---|---|---|---|
| A | 91154 | 33963 | 37.258924% |
| B | 91153 | 2455 | 2.693274% |
| C | 91158 | 1239 | 1.359179% |
| D | 91155 | 8612 | 9.447644% |
Noise dominated data is calculated using 1-second bins in cleaned event files. If a bin has >2000 counts, and if more than 50% of those come from <1% of pixels, then it is considered to be noise-dominated and hence unusable.
| Quadrant | # 1 sec bins | Bins with >0 counts | Bins with >2000 counts | High rate bins dominated by noise | Noise dominated (total time) | Noise dominated (detector-on time) | Marked lightcurve |
|---|---|---|---|---|---|---|---|
| A | 106627 | 87802 | 0 | 0 | 0.00% | 0.00% |  |
| B | 106627 | 91138 | 0 | 0 | 0.00% | 0.00% |  |
| C | 106628 | 91148 | 0 | 0 | 0.00% | 0.00% | 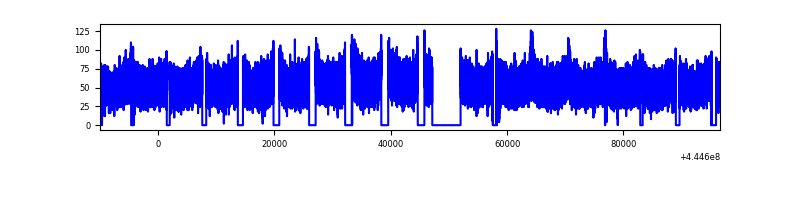 |
| D | 106628 | 90945 | 0 | 0 | 0.00% | 0.00% |  |
Top three noisy pixels from each quadrant. If the there are fewer than three noisy pixels in the level2.evt file, extra rows are filled as -1
| Pixel properties | Quadrant properties | ||||||
|---|---|---|---|---|---|---|---|
| Quadrant | DetID | PixID | Counts | Sigma | Mean | Median | Sigma |
| A | 7 | 110 | 3087 | 8.91 | 966 | 900 | 245.6 |
| A | 15 | 236 | 2916 | 8.21 | 966 | 900 | 245.6 |
| A | 0 | 29 | 2857 | 7.97 | 966 | 900 | 245.6 |
| B | 2 | 9 | 4421 | 13.43 | 1230 | 1168 | 242.2 |
| B | 2 | 8 | 3482 | 9.55 | 1230 | 1168 | 242.2 |
| B | 3 | 17 | 3441 | 9.39 | 1230 | 1168 | 242.2 |
| C | 3 | 202 | 3743 | 7.79 | 1282 | 1193 | 327.2 |
| C | 1 | 81 | 3726 | 7.74 | 1282 | 1193 | 327.2 |
| C | 1 | 80 | 3642 | 7.48 | 1282 | 1193 | 327.2 |
| D | 10 | 189 | 2926 | 6.07 | 1134 | 1029 | 312.6 |
| D | 4 | 12 | 2862 | 5.86 | 1134 | 1029 | 312.6 |
| D | 4 | 250 | 2766 | 5.56 | 1134 | 1029 | 312.6 |
Histogram calculated using DETX and DETY for each event in the final _common_clean file
| Quadrant A |  |
 |
Quadrant B |
|---|---|---|---|
| Quadrant D |  |
 |
Quadrant C |
| Plot type | Count rate plots | Images |
|---|---|---|
| Comparison with Poisson distribution Blue bars denote a histogram of data divided into 1 sec bins. Red curve is a Poisson curve with rate = median count rate of data. |
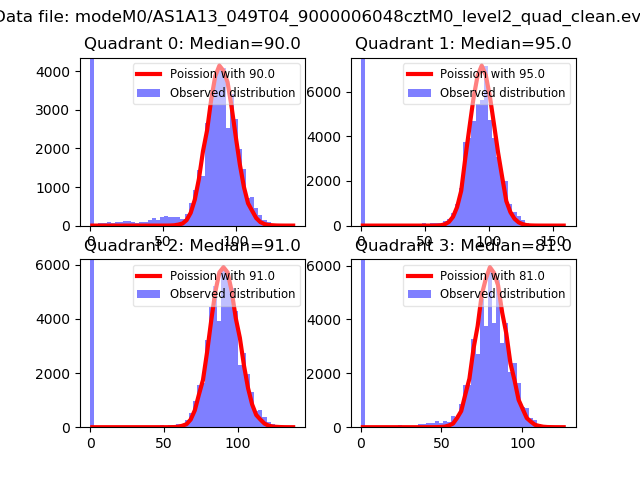 |
 |
| Quadrant-wise count rates Data is divided into 100 sec bins |
 |
|
| Module-wise count rates for Quadrant A Data is divided into 100 sec bins |
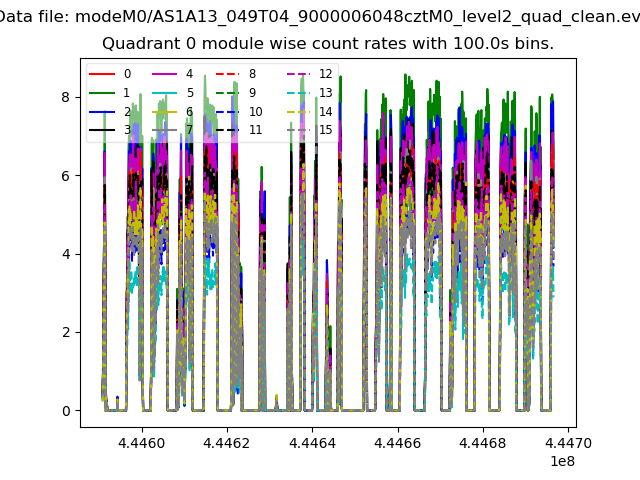 |
 |
| Module-wise count rates for Quadrant B Data is divided into 100 sec bins |
 |
 |
| Module-wise count rates for Quadrant C Data is divided into 100 sec bins |
 |
 |
| Module-wise count rates for Quadrant D Data is divided into 100 sec bins |
 |
 |
| Parameter | Plot |
|---|---|
| CZT HV Monitor |  |
| D_VDD |  |
| Temperature 1 | 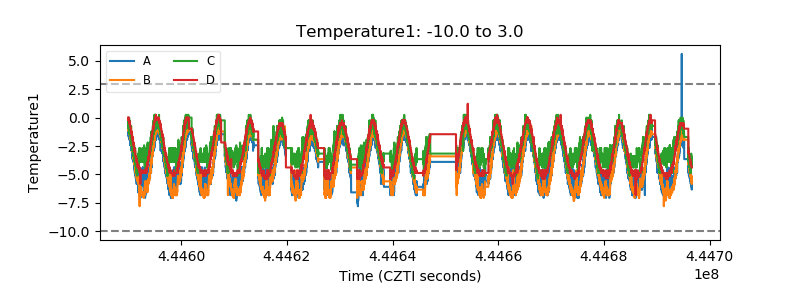 |
| Veto HV Monitor |  |
| Veto LLD |  |
| Alpha Counter |  |
| _CPM_Rate |  |
| CZT Counter |  |
| +2.5 Volts monitor |  |
| +5 Volts monitor |  |
| _ROLL_ROT |  |
| _Roll_DEC | 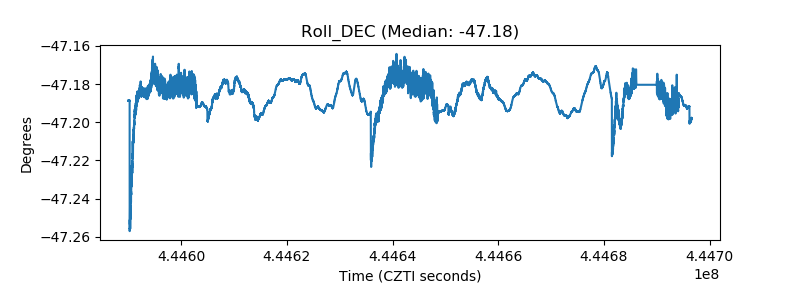 |
| _Roll_RA |  |
| Veto Counter |  |