| Param | Original file | Final file |
|---|---|---|
| Filename | modeM0/AS1A13_074T07_9000006036cztM0_level2.fits | modeM0/AS1A13_074T07_9000006036cztM0_level2_quad_clean.evt |
| Size (bytes) | 79,223,040 | 86,754,240 |
| Size | 75.6 MB | 82.7 MB |
| Events in quadrant A | 481,796 | 548,470 |
| Events in quadrant B | 470,792 | 552,082 |
| Events in quadrant C | 492,100 | 531,321 |
| Events in quadrant D | 360,158 | 401,239 |
| Mode M9 | |||
|---|---|---|---|
| Quadrant | BADHDUFLAG | Total packets | Discarded packets |
| A | 0 | 25 | 0 |
| B | 0 | 25 | 0 |
| C | 0 | 25 | 0 |
| D | 0 | 25 | 0 |
| Mode SS | |||
|---|---|---|---|
| Quadrant | BADHDUFLAG | Total packets | Discarded packets |
| A | 0 | 172 | 0 |
| B | 0 | 172 | 0 |
| C | 0 | 172 | 0 |
| D | 0 | 172 | 0 |
| Mode M0 | |||
|---|---|---|---|
| Quadrant | BADHDUFLAG | Total packets | Discarded packets |
| A | 0 | 27707 | 0 |
| B | 0 | 19388 | 0 |
| C | 0 | 17962 | 0 |
| D | 0 | 44462 | 0 |
| Quadrant | Total seconds | Saturated seconds | Saturation percentage |
|---|---|---|---|
| A | 8556 | 363 | 4.242637% |
| B | 8556 | 224 | 2.618046% |
| C | 8556 | 67 | 0.783076% |
| D | 8556 | 2436 | 28.471248% |
Noise dominated data is calculated using 1-second bins in cleaned event files. If a bin has >2000 counts, and if more than 50% of those come from <1% of pixels, then it is considered to be noise-dominated and hence unusable.
| Quadrant | # 1 sec bins | Bins with >0 counts | Bins with >2000 counts | High rate bins dominated by noise | Noise dominated (total time) | Noise dominated (detector-on time) | Marked lightcurve |
|---|---|---|---|---|---|---|---|
| A | 10901 | 8556 | 0 | 0 | 0.00% | 0.00% |  |
| B | 10901 | 8555 | 0 | 0 | 0.00% | 0.00% | 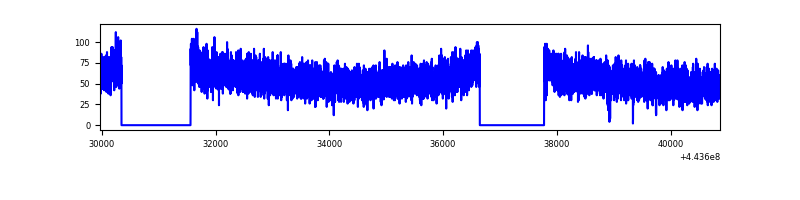 |
| C | 10901 | 8556 | 0 | 0 | 0.00% | 0.00% |  |
| D | 10901 | 8532 | 0 | 0 | 0.00% | 0.00% |  |
Top three noisy pixels from each quadrant. If the there are fewer than three noisy pixels in the level2.evt file, extra rows are filled as -1
| Pixel properties | Quadrant properties | ||||||
|---|---|---|---|---|---|---|---|
| Quadrant | DetID | PixID | Counts | Sigma | Mean | Median | Sigma |
| A | 0 | 29 | 422 | 9.05 | 125 | 118 | 33.6 |
| A | 15 | 236 | 412 | 8.75 | 125 | 118 | 33.6 |
| A | 7 | 110 | 409 | 8.66 | 125 | 118 | 33.6 |
| B | 2 | 9 | 428 | 11.06 | 124 | 118 | 28.0 |
| B | 2 | 8 | 352 | 8.34 | 124 | 118 | 28.0 |
| B | 5 | 232 | 315 | 7.03 | 124 | 118 | 28.0 |
| C | 3 | 158 | 379 | 7.31 | 130 | 121 | 35.3 |
| C | 3 | 202 | 374 | 7.17 | 130 | 121 | 35.3 |
| C | 1 | 81 | 363 | 6.85 | 130 | 121 | 35.3 |
| D | 8 | 176 | 362 | 8.93 | 103 | 93 | 30.1 |
| D | 8 | 160 | 279 | 6.17 | 103 | 93 | 30.1 |
| D | 15 | 63 | 277 | 6.11 | 103 | 93 | 30.1 |
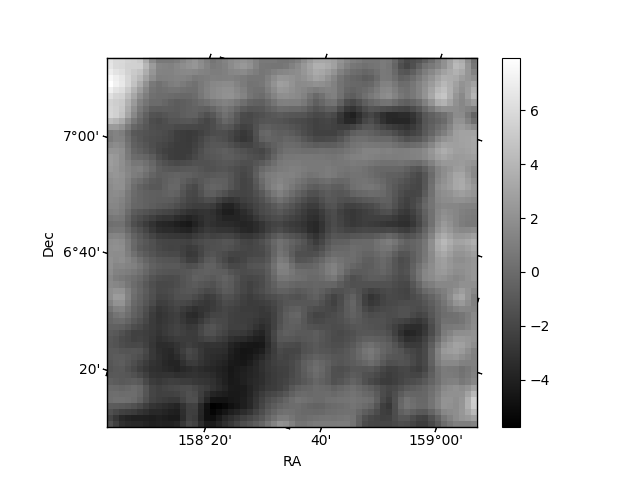
Histogram calculated using DETX and DETY for each event in the final _common_clean file
| Quadrant A | 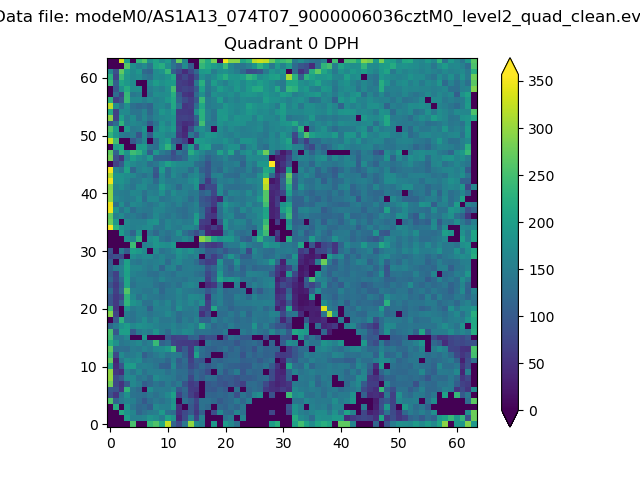 |
 |
Quadrant B |
|---|---|---|---|
| Quadrant D |  |
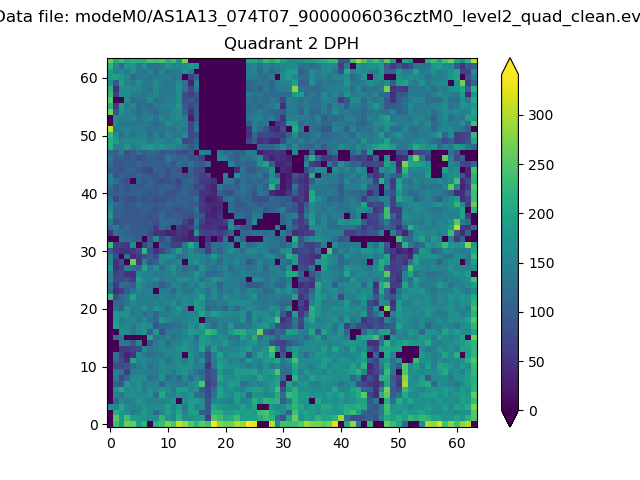 |
Quadrant C |
| Plot type | Count rate plots | Images |
|---|---|---|
| Comparison with Poisson distribution Blue bars denote a histogram of data divided into 1 sec bins. Red curve is a Poisson curve with rate = median count rate of data. |
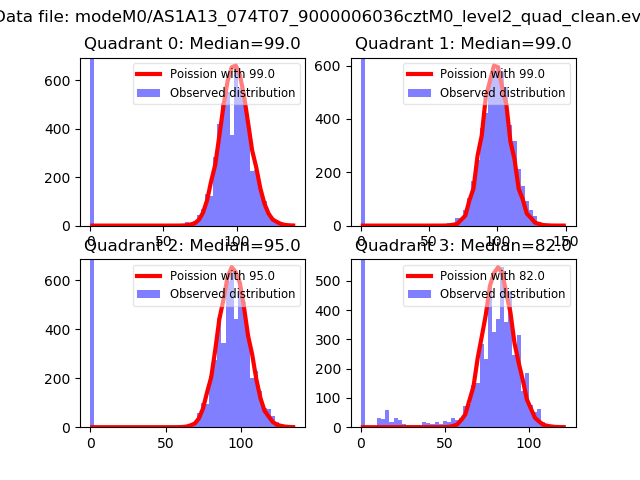 |
 |
| Quadrant-wise count rates Data is divided into 100 sec bins |
 |
|
| Module-wise count rates for Quadrant A Data is divided into 100 sec bins |
 |
 |
| Module-wise count rates for Quadrant B Data is divided into 100 sec bins |
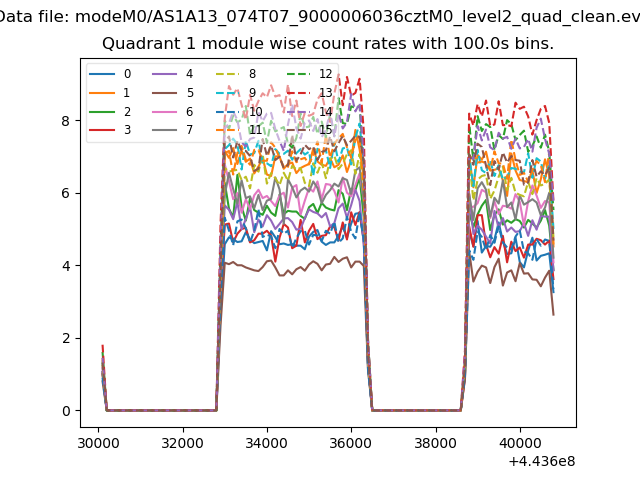 |
 |
| Module-wise count rates for Quadrant C Data is divided into 100 sec bins |
 |
 |
| Module-wise count rates for Quadrant D Data is divided into 100 sec bins |
 |
 |
| Parameter | Plot |
|---|---|
| CZT HV Monitor |  |
| D_VDD |  |
| Temperature 1 |  |
| Veto HV Monitor |  |
| Veto LLD |  |
| Alpha Counter |  |
| _CPM_Rate |  |
| CZT Counter |  |
| +2.5 Volts monitor |  |
| +5 Volts monitor |  |
| _ROLL_ROT |  |
| _Roll_DEC |  |
| _Roll_RA | 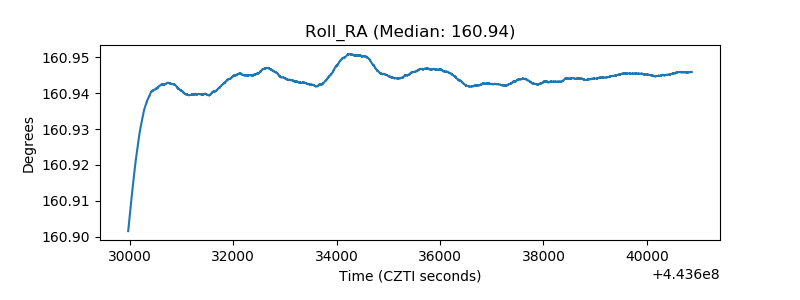 |
| Veto Counter |  |