| Param | Original file | Final file |
|---|---|---|
| Filename | modeM0/AS1A13_044T02_9000006038cztM0_level2.fits | modeM0/AS1A13_044T02_9000006038cztM0_level2_quad_clean.evt |
| Size (bytes) | 195,333,120 | 183,983,040 |
| Size | 186.3 MB | 175.5 MB |
| Events in quadrant A | 1,184,676 | 1,156,134 |
| Events in quadrant B | 1,155,532 | 1,176,668 |
| Events in quadrant C | 1,189,472 | 1,091,548 |
| Events in quadrant D | 802,436 | 567,317 |
| Mode SS | |||
|---|---|---|---|
| Quadrant | BADHDUFLAG | Total packets | Discarded packets |
| A | 0 | 462 | 0 |
| B | 0 | 462 | 0 |
| C | 0 | 462 | 0 |
| D | 0 | 462 | 0 |
| Mode M9 | |||
|---|---|---|---|
| Quadrant | BADHDUFLAG | Total packets | Discarded packets |
| A | 0 | 10 | 0 |
| B | 0 | 10 | 0 |
| C | 0 | 10 | 0 |
| D | 0 | 10 | 0 |
| Mode M0 | |||
|---|---|---|---|
| Quadrant | BADHDUFLAG | Total packets | Discarded packets |
| A | 0 | 75210 | 0 |
| B | 0 | 53453 | 0 |
| C | 0 | 50277 | 0 |
| D | 0 | 124684 | 0 |
| Quadrant | Total seconds | Saturated seconds | Saturation percentage |
|---|---|---|---|
| A | 22945 | 499 | 2.174766% |
| B | 22944 | 425 | 1.852336% |
| C | 22944 | 268 | 1.168061% |
| D | 22945 | 9326 | 40.645021% |
Noise dominated data is calculated using 1-second bins in cleaned event files. If a bin has >2000 counts, and if more than 50% of those come from <1% of pixels, then it is considered to be noise-dominated and hence unusable.
| Quadrant | # 1 sec bins | Bins with >0 counts | Bins with >2000 counts | High rate bins dominated by noise | Noise dominated (total time) | Noise dominated (detector-on time) | Marked lightcurve |
|---|---|---|---|---|---|---|---|
| A | 23905 | 22945 | 0 | 0 | 0.00% | 0.00% | 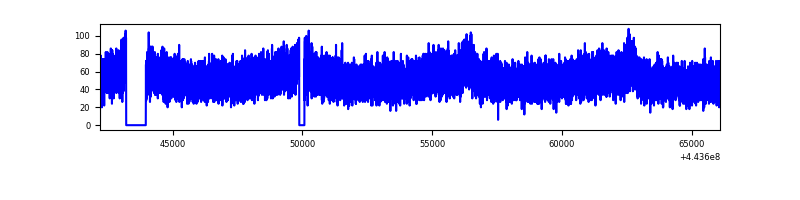 |
| B | 23905 | 22944 | 0 | 0 | 0.00% | 0.00% |  |
| C | 23905 | 22944 | 0 | 0 | 0.00% | 0.00% |  |
| D | 23905 | 22748 | 0 | 0 | 0.00% | 0.00% |  |
Top three noisy pixels from each quadrant. If the there are fewer than three noisy pixels in the level2.evt file, extra rows are filled as -1
| Pixel properties | Quadrant properties | ||||||
|---|---|---|---|---|---|---|---|
| Quadrant | DetID | PixID | Counts | Sigma | Mean | Median | Sigma |
| A | 15 | 236 | 940 | 8.03 | 309 | 288 | 81.2 |
| A | 7 | 110 | 901 | 7.55 | 309 | 288 | 81.2 |
| A | 0 | 29 | 891 | 7.43 | 309 | 288 | 81.2 |
| B | 2 | 9 | 1052 | 12.19 | 305 | 290 | 62.5 |
| B | 2 | 8 | 849 | 8.94 | 305 | 290 | 62.5 |
| B | 3 | 17 | 829 | 8.62 | 305 | 290 | 62.5 |
| C | 1 | 81 | 950 | 7.92 | 315 | 292 | 83.0 |
| C | 1 | 80 | 924 | 7.61 | 315 | 292 | 83.0 |
| C | 3 | 158 | 862 | 6.86 | 315 | 292 | 83.0 |
| D | 8 | 176 | 741 | 8.08 | 230 | 209 | 65.8 |
| D | 6 | 67 | 594 | 5.85 | 230 | 209 | 65.8 |
| D | 8 | 160 | 588 | 5.76 | 230 | 209 | 65.8 |
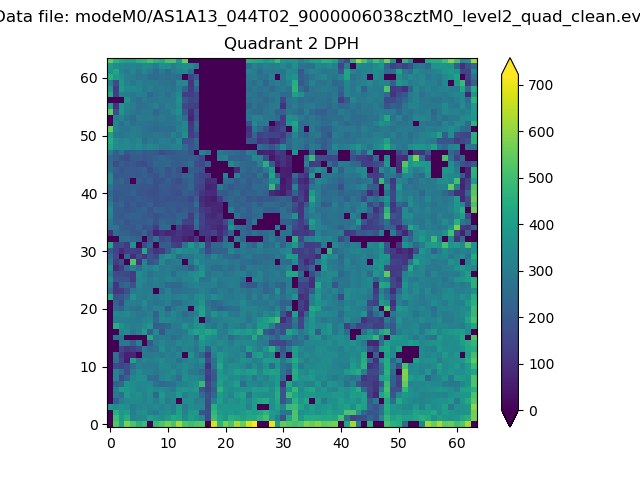
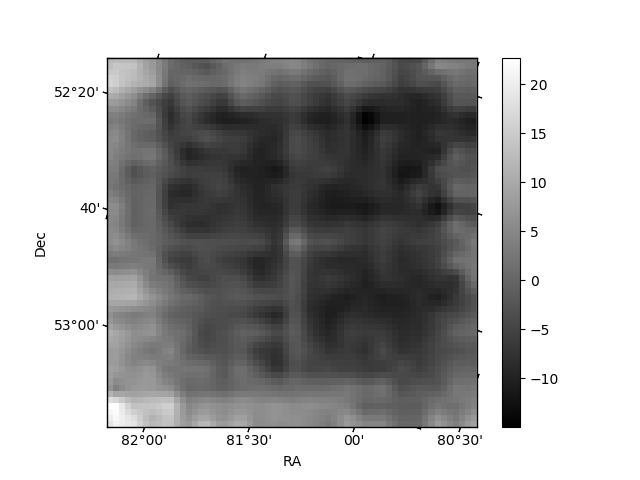
Histogram calculated using DETX and DETY for each event in the final _common_clean file
| Quadrant A |  |
 |
Quadrant B |
|---|---|---|---|
| Quadrant D | 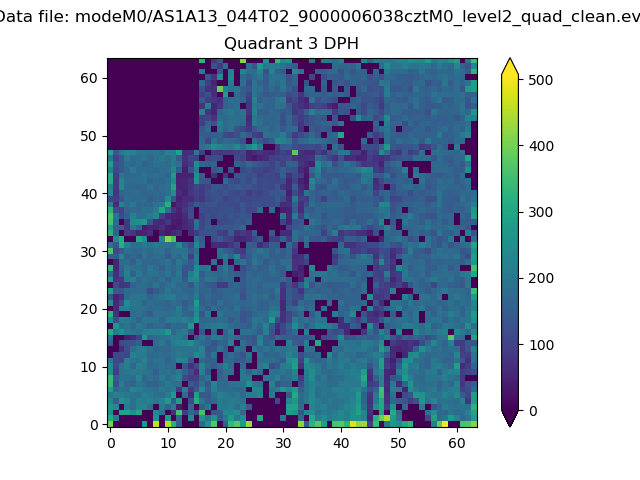 |
 |
Quadrant C |
| Plot type | Count rate plots | Images |
|---|---|---|
| Comparison with Poisson distribution Blue bars denote a histogram of data divided into 1 sec bins. Red curve is a Poisson curve with rate = median count rate of data. |
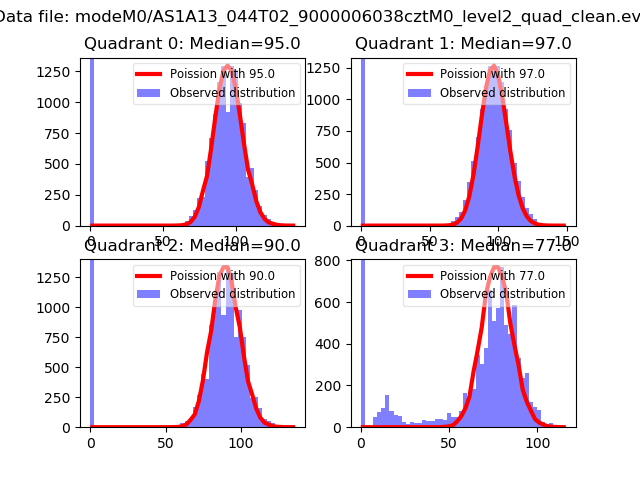 |
 |
| Quadrant-wise count rates Data is divided into 100 sec bins |
 |
|
| Module-wise count rates for Quadrant A Data is divided into 100 sec bins |
 |
 |
| Module-wise count rates for Quadrant B Data is divided into 100 sec bins |
 |
 |
| Module-wise count rates for Quadrant C Data is divided into 100 sec bins |
 |
 |
| Module-wise count rates for Quadrant D Data is divided into 100 sec bins |
 |
 |
| Parameter | Plot |
|---|---|
| CZT HV Monitor |  |
| D_VDD |  |
| Temperature 1 |  |
| Veto HV Monitor |  |
| Veto LLD |  |
| Alpha Counter |  |
| _CPM_Rate |  |
| CZT Counter |  |
| +2.5 Volts monitor | 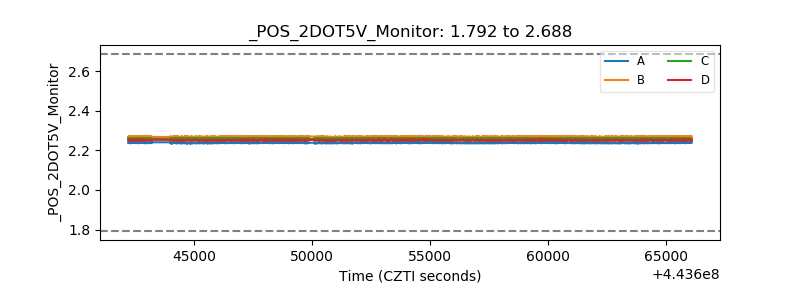 |
| +5 Volts monitor |  |
| _ROLL_ROT |  |
| _Roll_DEC |  |
| _Roll_RA |  |
| Veto Counter |  |