| Param | Original file | Final file |
|---|---|---|
| Filename | modeM0/AS1A13_044T01_9000006034cztM0_level2.fits | modeM0/AS1A13_044T01_9000006034cztM0_level2_quad_clean.evt |
| Size (bytes) | 715,167,360 | 752,829,120 |
| Size | 682.0 MB | 718.0 MB |
| Events in quadrant A | 4,302,720 | 4,617,985 |
| Events in quadrant B | 4,087,790 | 4,568,860 |
| Events in quadrant C | 4,307,688 | 4,400,491 |
| Events in quadrant D | 3,463,044 | 3,720,462 |
| Mode M9 | |||
|---|---|---|---|
| Quadrant | BADHDUFLAG | Total packets | Discarded packets |
| A | 0 | 102 | 0 |
| B | 0 | 102 | 0 |
| C | 0 | 102 | 0 |
| D | 0 | 102 | 0 |
| Mode M0 | |||
|---|---|---|---|
| Quadrant | BADHDUFLAG | Total packets | Discarded packets |
| A | 0 | 252380 | 0 |
| B | 0 | 200911 | 0 |
| C | 0 | 169560 | 0 |
| D | 0 | 297510 | 0 |
| Mode SS | |||
|---|---|---|---|
| Quadrant | BADHDUFLAG | Total packets | Discarded packets |
| A | 0 | 1628 | 0 |
| B | 0 | 1628 | 0 |
| C | 0 | 1628 | 0 |
| D | 0 | 1628 | 0 |
| Quadrant | Total seconds | Saturated seconds | Saturation percentage |
|---|---|---|---|
| A | 80079 | 2220 | 2.772262% |
| B | 80079 | 3370 | 4.208344% |
| C | 80080 | 722 | 0.901598% |
| D | 80080 | 9601 | 11.989261% |
Noise dominated data is calculated using 1-second bins in cleaned event files. If a bin has >2000 counts, and if more than 50% of those come from <1% of pixels, then it is considered to be noise-dominated and hence unusable.
| Quadrant | # 1 sec bins | Bins with >0 counts | Bins with >2000 counts | High rate bins dominated by noise | Noise dominated (total time) | Noise dominated (detector-on time) | Marked lightcurve |
|---|---|---|---|---|---|---|---|
| A | 90434 | 80079 | 0 | 0 | 0.00% | 0.00% |  |
| B | 90435 | 79881 | 0 | 0 | 0.00% | 0.00% |  |
| C | 90435 | 80077 | 0 | 0 | 0.00% | 0.00% | 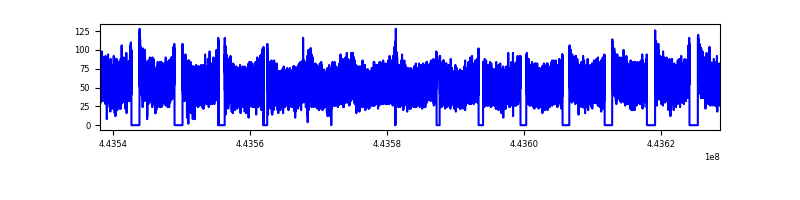 |
| D | 90435 | 79979 | 0 | 0 | 0.00% | 0.00% |  |
Top three noisy pixels from each quadrant. If the there are fewer than three noisy pixels in the level2.evt file, extra rows are filled as -1
| Pixel properties | Quadrant properties | ||||||
|---|---|---|---|---|---|---|---|
| Quadrant | DetID | PixID | Counts | Sigma | Mean | Median | Sigma |
| A | 15 | 236 | 3465 | 8.56 | 1119 | 1047 | 282.4 |
| A | 7 | 110 | 3424 | 8.42 | 1119 | 1047 | 282.4 |
| A | 0 | 29 | 3328 | 8.08 | 1119 | 1047 | 282.4 |
| B | 2 | 9 | 3766 | 12.97 | 1084 | 1034 | 210.6 |
| B | 2 | 8 | 3040 | 9.53 | 1084 | 1034 | 210.6 |
| B | 3 | 17 | 3001 | 9.34 | 1084 | 1034 | 210.6 |
| C | 1 | 81 | 3352 | 7.79 | 1139 | 1059 | 294.2 |
| C | 3 | 202 | 3295 | 7.6 | 1139 | 1059 | 294.2 |
| C | 1 | 80 | 3249 | 7.44 | 1139 | 1059 | 294.2 |
| D | 10 | 189 | 2647 | 6.35 | 999 | 908 | 274.0 |
| D | 7 | 3 | 2561 | 6.03 | 999 | 908 | 274.0 |
| D | 4 | 12 | 2515 | 5.86 | 999 | 908 | 274.0 |
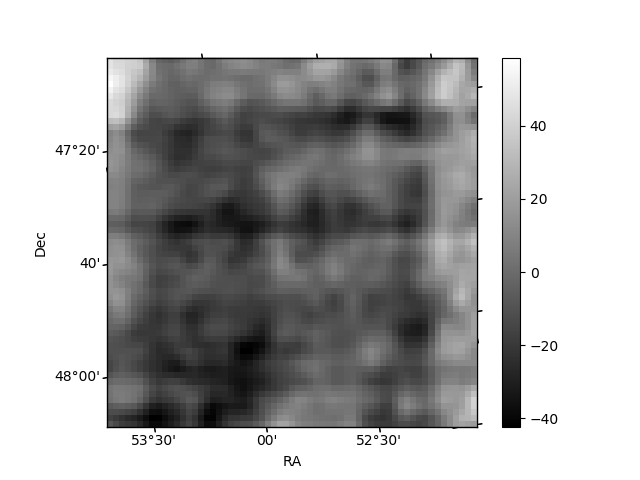
Histogram calculated using DETX and DETY for each event in the final _common_clean file
| Quadrant A | 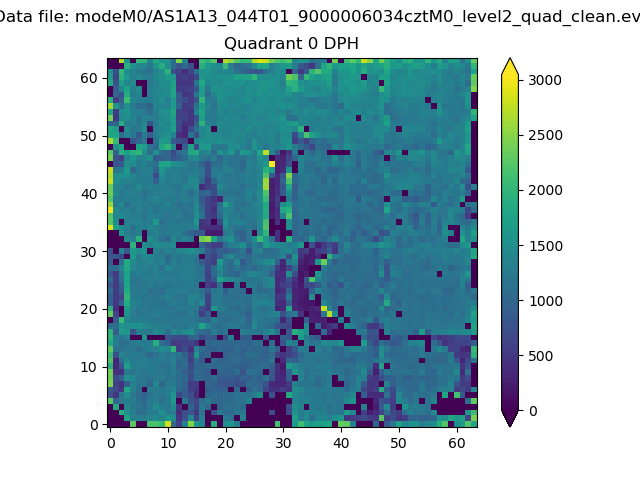 |
 |
Quadrant B |
|---|---|---|---|
| Quadrant D | 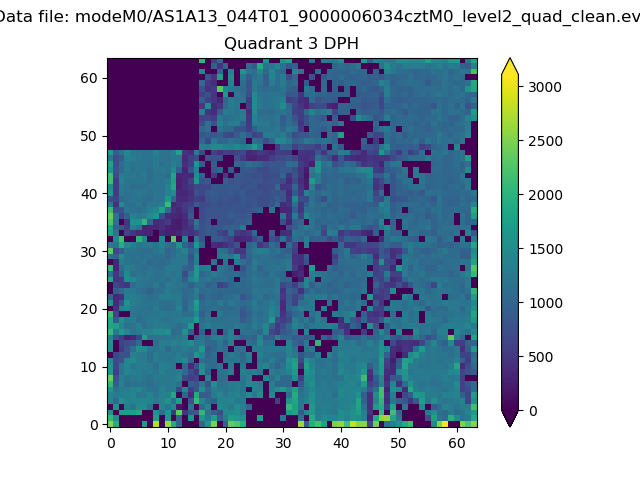 |
 |
Quadrant C |
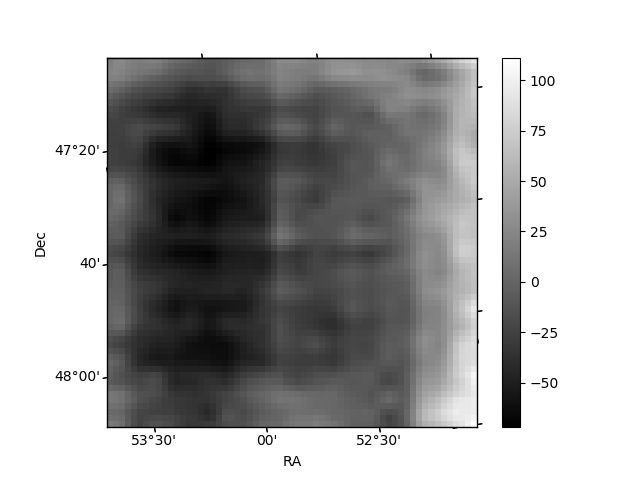
| Plot type | Count rate plots | Images |
|---|---|---|
| Comparison with Poisson distribution Blue bars denote a histogram of data divided into 1 sec bins. Red curve is a Poisson curve with rate = median count rate of data. |
 |
 |
| Quadrant-wise count rates Data is divided into 100 sec bins |
 |
|
| Module-wise count rates for Quadrant A Data is divided into 100 sec bins |
 |
 |
| Module-wise count rates for Quadrant B Data is divided into 100 sec bins |
 |
 |
| Module-wise count rates for Quadrant C Data is divided into 100 sec bins |
 |
 |
| Module-wise count rates for Quadrant D Data is divided into 100 sec bins |
 |
 |
| Parameter | Plot |
|---|---|
| CZT HV Monitor |  |
| D_VDD |  |
| Temperature 1 |  |
| Veto HV Monitor |  |
| Veto LLD |  |
| Alpha Counter |  |
| _CPM_Rate |  |
| CZT Counter | 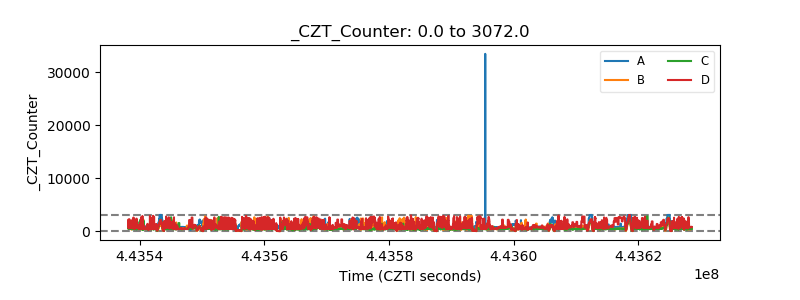 |
| +2.5 Volts monitor | 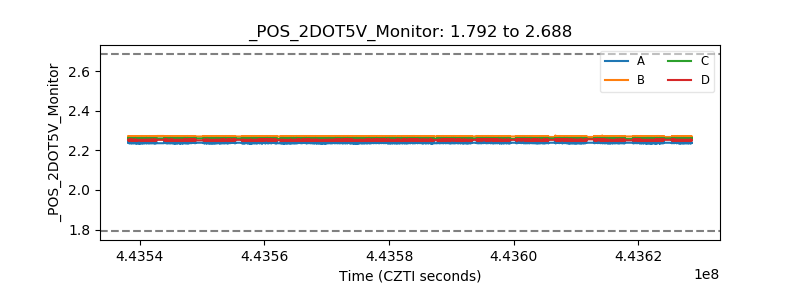 |
| +5 Volts monitor |  |
| _ROLL_ROT |  |
| _Roll_DEC |  |
| _Roll_RA | 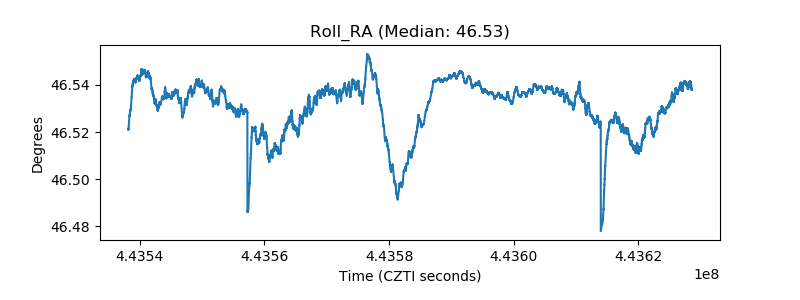 |
| Veto Counter |  |