| Param | Original file | Final file |
|---|---|---|
| Filename | modeM0/AS1A13_024T02_9000006026cztM0_level2.fits | modeM0/AS1A13_024T02_9000006026cztM0_level2_quad_clean.evt |
| Size (bytes) | 394,367,040 | 504,662,400 |
| Size | 376.1 MB | 481.3 MB |
| Events in quadrant A | 2,009,224 | 2,526,099 |
| Events in quadrant B | 2,338,362 | 3,504,414 |
| Events in quadrant C | 2,435,636 | 3,340,817 |
| Events in quadrant D | 1,898,864 | 2,661,491 |
| Mode SS | |||
|---|---|---|---|
| Quadrant | BADHDUFLAG | Total packets | Discarded packets |
| A | 0 | 964 | 0 |
| B | 0 | 964 | 0 |
| C | 0 | 964 | 0 |
| D | 0 | 964 | 0 |
| Mode M0 | |||
|---|---|---|---|
| Quadrant | BADHDUFLAG | Total packets | Discarded packets |
| A | 0 | 243284 | 0 |
| B | 0 | 107552 | 0 |
| C | 0 | 99592 | 0 |
| D | 0 | 231547 | 0 |
| Mode M9 | |||
|---|---|---|---|
| Quadrant | BADHDUFLAG | Total packets | Discarded packets |
| A | 0 | 46 | 0 |
| B | 0 | 46 | 0 |
| C | 0 | 46 | 0 |
| D | 0 | 46 | 0 |
| Quadrant | Total seconds | Saturated seconds | Saturation percentage |
|---|---|---|---|
| A | 47344 | 14977 | 31.634420% |
| B | 47345 | 1566 | 3.307635% |
| C | 47345 | 518 | 1.094097% |
| D | 47343 | 7013 | 14.813172% |
Noise dominated data is calculated using 1-second bins in cleaned event files. If a bin has >2000 counts, and if more than 50% of those come from <1% of pixels, then it is considered to be noise-dominated and hence unusable.
| Quadrant | # 1 sec bins | Bins with >0 counts | Bins with >2000 counts | High rate bins dominated by noise | Noise dominated (total time) | Noise dominated (detector-on time) | Marked lightcurve |
|---|---|---|---|---|---|---|---|
| A | 52098 | 47070 | 0 | 0 | 0.00% | 0.00% |  |
| B | 52099 | 47278 | 0 | 0 | 0.00% | 0.00% |  |
| C | 52099 | 47334 | 0 | 0 | 0.00% | 0.00% |  |
| D | 52099 | 47228 | 0 | 0 | 0.00% | 0.00% | 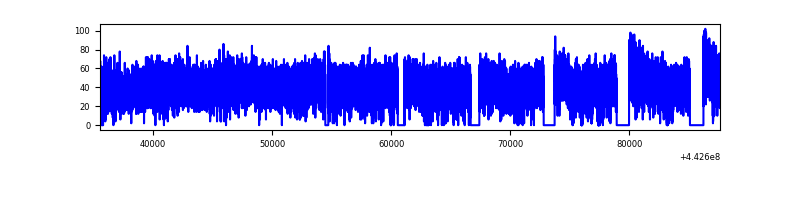 |
Top three noisy pixels from each quadrant. If the there are fewer than three noisy pixels in the level2.evt file, extra rows are filled as -1
| Pixel properties | Quadrant properties | ||||||
|---|---|---|---|---|---|---|---|
| Quadrant | DetID | PixID | Counts | Sigma | Mean | Median | Sigma |
| A | 7 | 110 | 1683 | 8.83 | 523 | 490 | 135.1 |
| A | 7 | 109 | 1585 | 8.11 | 523 | 490 | 135.1 |
| A | 0 | 29 | 1579 | 8.06 | 523 | 490 | 135.1 |
| B | 2 | 9 | 2158 | 12.77 | 617 | 587 | 123.0 |
| B | 2 | 8 | 1793 | 9.8 | 617 | 587 | 123.0 |
| B | 3 | 17 | 1673 | 8.83 | 617 | 587 | 123.0 |
| C | 1 | 81 | 1913 | 7.88 | 643 | 598 | 166.8 |
| C | 3 | 202 | 1869 | 7.62 | 643 | 598 | 166.8 |
| C | 1 | 80 | 1864 | 7.59 | 643 | 598 | 166.8 |
| D | 8 | 176 | 1835 | 8.83 | 543 | 492 | 152.2 |
| D | 4 | 16 | 1401 | 5.97 | 543 | 492 | 152.2 |
| D | 10 | 189 | 1394 | 5.93 | 543 | 492 | 152.2 |
Histogram calculated using DETX and DETY for each event in the final _common_clean file
| Quadrant A | 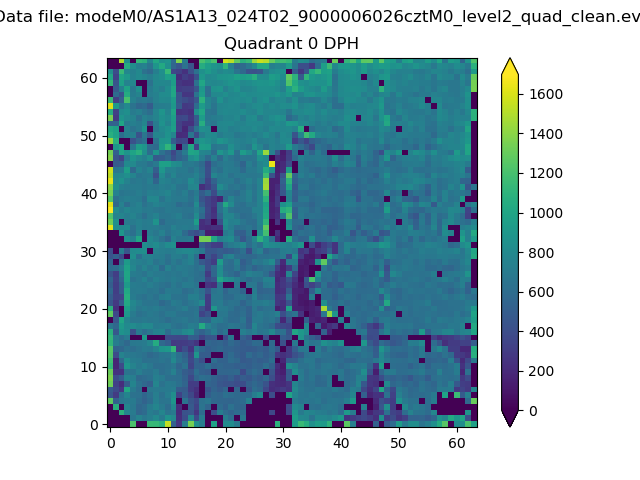 |
 |
Quadrant B |
|---|---|---|---|
| Quadrant D | 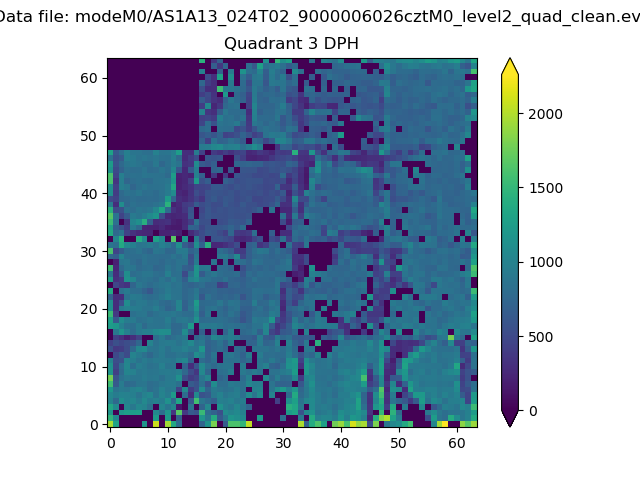 |
 |
Quadrant C |
| Plot type | Count rate plots | Images |
|---|---|---|
| Comparison with Poisson distribution Blue bars denote a histogram of data divided into 1 sec bins. Red curve is a Poisson curve with rate = median count rate of data. |
 |
 |
| Quadrant-wise count rates Data is divided into 100 sec bins |
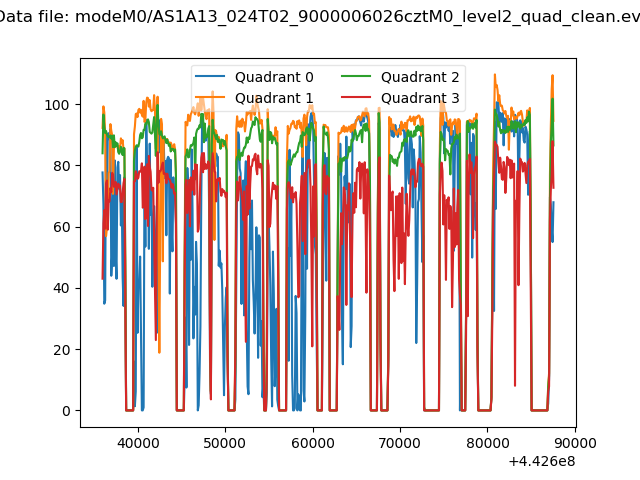 |
|
| Module-wise count rates for Quadrant A Data is divided into 100 sec bins |
 |
 |
| Module-wise count rates for Quadrant B Data is divided into 100 sec bins |
 |
 |
| Module-wise count rates for Quadrant C Data is divided into 100 sec bins |
 |
 |
| Module-wise count rates for Quadrant D Data is divided into 100 sec bins |
 |
 |
| Parameter | Plot |
|---|---|
| CZT HV Monitor |  |
| D_VDD |  |
| Temperature 1 |  |
| Veto HV Monitor |  |
| Veto LLD |  |
| Alpha Counter |  |
| _CPM_Rate |  |
| CZT Counter | 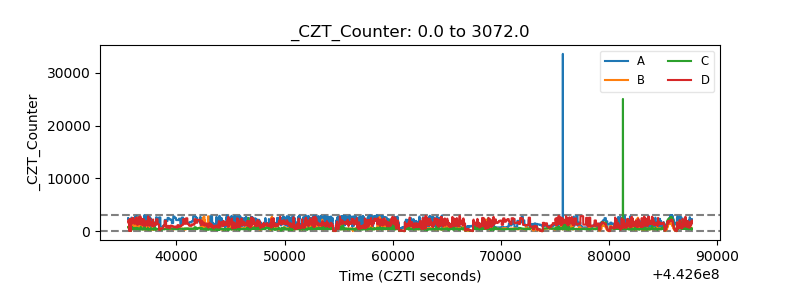 |
| +2.5 Volts monitor |  |
| +5 Volts monitor |  |
| _ROLL_ROT |  |
| _Roll_DEC |  |
| _Roll_RA |  |
| Veto Counter |  |