| Param | Original file | Final file |
|---|---|---|
| Filename | modeM0/AS1A13_017T01_9000006028cztM0_level2.fits | modeM0/AS1A13_017T01_9000006028cztM0_level2_quad_clean.evt |
| Size (bytes) | 1,936,324,800 | 2,052,820,800 |
| Size | 1.8 GB | 1.9 GB |
| Events in quadrant A | 11,441,804 | 12,198,713 |
| Events in quadrant B | 11,263,422 | 12,665,804 |
| Events in quadrant C | 11,639,608 | 12,208,139 |
| Events in quadrant D | 9,442,912 | 10,264,646 |
| Mode M0 | |||
|---|---|---|---|
| Quadrant | BADHDUFLAG | Total packets | Discarded packets |
| A | 0 | 697418 | 0 |
| B | 0 | 484436 | 0 |
| C | 0 | 482054 | 0 |
| D | 0 | 784036 | 0 |
| Mode SS | |||
|---|---|---|---|
| Quadrant | BADHDUFLAG | Total packets | Discarded packets |
| A | 0 | 4396 | 0 |
| B | 0 | 4396 | 0 |
| C | 0 | 4396 | 0 |
| D | 0 | 4396 | 0 |
| Mode M9 | |||
|---|---|---|---|
| Quadrant | BADHDUFLAG | Total packets | Discarded packets |
| A | 0 | 295 | 0 |
| B | 0 | 295 | 0 |
| C | 0 | 295 | 0 |
| D | 0 | 295 | 0 |
| Quadrant | Total seconds | Saturated seconds | Saturation percentage |
|---|---|---|---|
| A | 216585 | 9668 | 4.463836% |
| B | 216596 | 4733 | 2.185174% |
| C | 216609 | 4964 | 2.291687% |
| D | 216556 | 24890 | 11.493563% |
Noise dominated data is calculated using 1-second bins in cleaned event files. If a bin has >2000 counts, and if more than 50% of those come from <1% of pixels, then it is considered to be noise-dominated and hence unusable.
| Quadrant | # 1 sec bins | Bins with >0 counts | Bins with >2000 counts | High rate bins dominated by noise | Noise dominated (total time) | Noise dominated (detector-on time) | Marked lightcurve |
|---|---|---|---|---|---|---|---|
| A | 299002 | 216517 | 0 | 0 | 0.00% | 0.00% |  |
| B | 299002 | 216612 | 0 | 0 | 0.00% | 0.00% |  |
| C | 299002 | 216602 | 0 | 0 | 0.00% | 0.00% |  |
| D | 299002 | 216234 | 0 | 0 | 0.00% | 0.00% |  |
Top three noisy pixels from each quadrant. If the there are fewer than three noisy pixels in the level2.evt file, extra rows are filled as -1
| Pixel properties | Quadrant properties | ||||||
|---|---|---|---|---|---|---|---|
| Quadrant | DetID | PixID | Counts | Sigma | Mean | Median | Sigma |
| A | 7 | 110 | 9416 | 8.82 | 2980 | 2787 | 751.3 |
| A | 0 | 29 | 9053 | 8.34 | 2980 | 2787 | 751.3 |
| A | 15 | 236 | 8854 | 8.08 | 2980 | 2787 | 751.3 |
| B | 2 | 9 | 10466 | 13.07 | 2980 | 2834 | 584.0 |
| B | 2 | 8 | 8415 | 9.56 | 2980 | 2834 | 584.0 |
| B | 3 | 17 | 8173 | 9.14 | 2980 | 2834 | 584.0 |
| C | 3 | 202 | 9114 | 8.0 | 3083 | 2875 | 779.6 |
| C | 1 | 81 | 8901 | 7.73 | 3083 | 2875 | 779.6 |
| C | 3 | 203 | 8801 | 7.6 | 3083 | 2875 | 779.6 |
| D | 8 | 176 | 9453 | 9.41 | 2711 | 2468 | 742.0 |
| D | 8 | 160 | 6954 | 6.05 | 2711 | 2468 | 742.0 |
| D | 10 | 189 | 6921 | 6.0 | 2711 | 2468 | 742.0 |
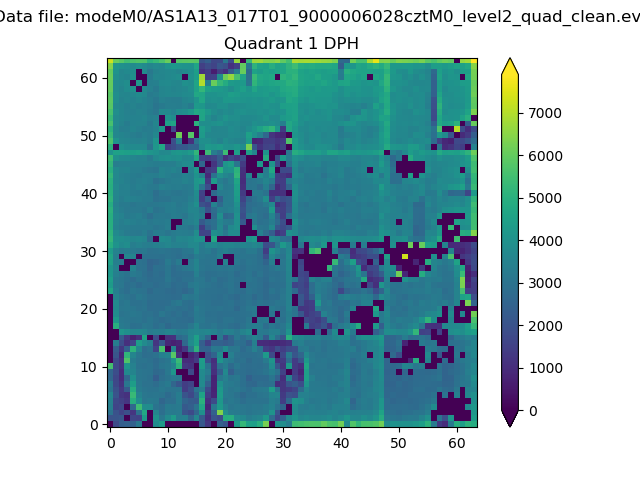
Histogram calculated using DETX and DETY for each event in the final _common_clean file
| Quadrant A |  |
 |
Quadrant B |
|---|---|---|---|
| Quadrant D | 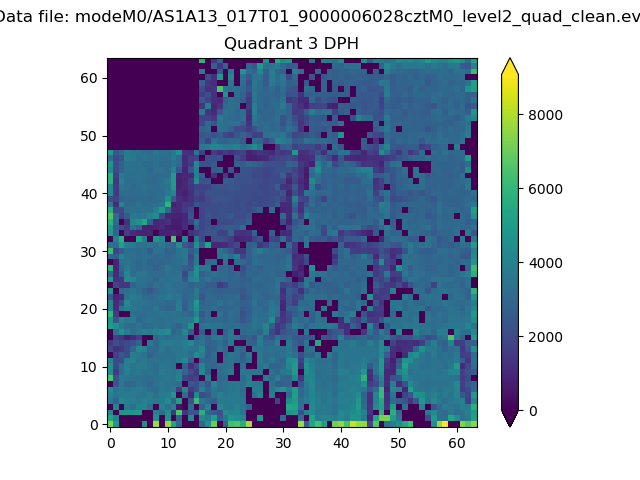 |
 |
Quadrant C |
| Plot type | Count rate plots | Images |
|---|---|---|
| Comparison with Poisson distribution Blue bars denote a histogram of data divided into 1 sec bins. Red curve is a Poisson curve with rate = median count rate of data. |
 |
 |
| Quadrant-wise count rates Data is divided into 100 sec bins |
 |
|
| Module-wise count rates for Quadrant A Data is divided into 100 sec bins |
 |
 |
| Module-wise count rates for Quadrant B Data is divided into 100 sec bins |
 |
 |
| Module-wise count rates for Quadrant C Data is divided into 100 sec bins |
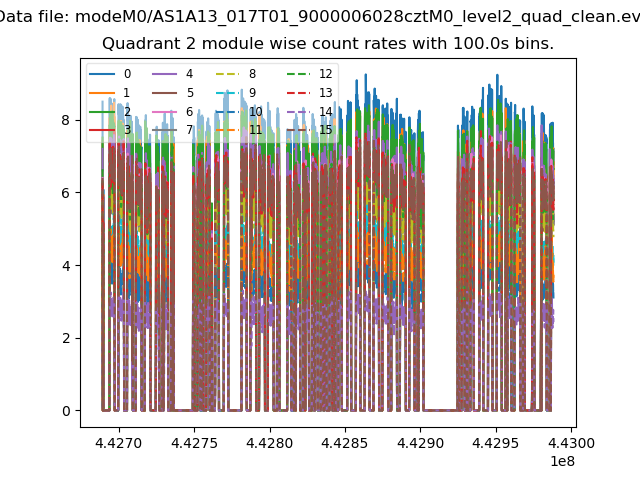 |
 |
| Module-wise count rates for Quadrant D Data is divided into 100 sec bins |
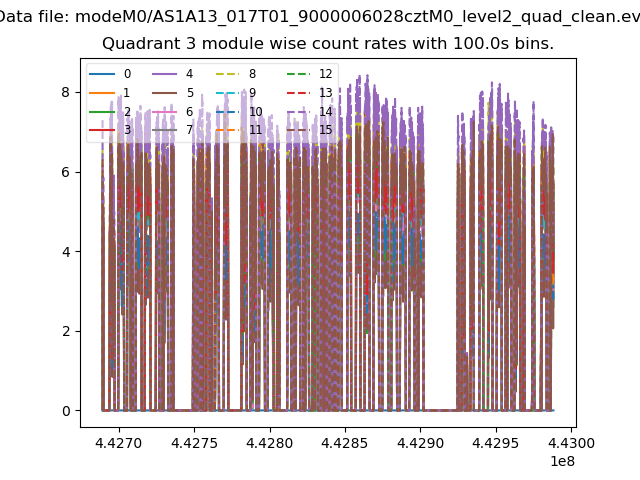 |
 |
| Parameter | Plot |
|---|---|
| CZT HV Monitor | 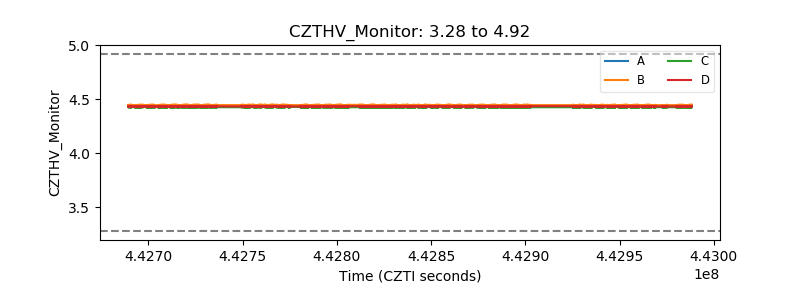 |
| D_VDD |  |
| Temperature 1 |  |
| Veto HV Monitor |  |
| Veto LLD |  |
| Alpha Counter |  |
| _CPM_Rate |  |
| CZT Counter |  |
| +2.5 Volts monitor |  |
| +5 Volts monitor |  |
| _ROLL_ROT |  |
| _Roll_DEC | 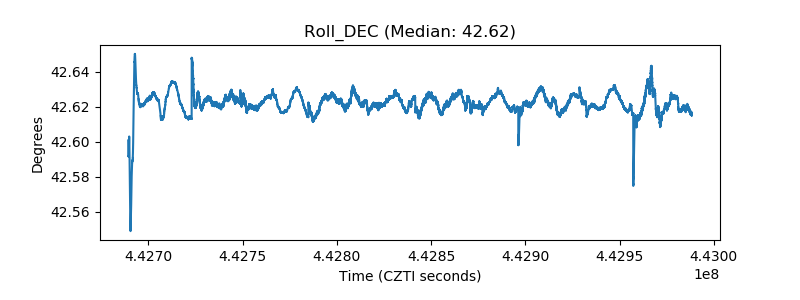 |
| _Roll_RA |  |
| Veto Counter | 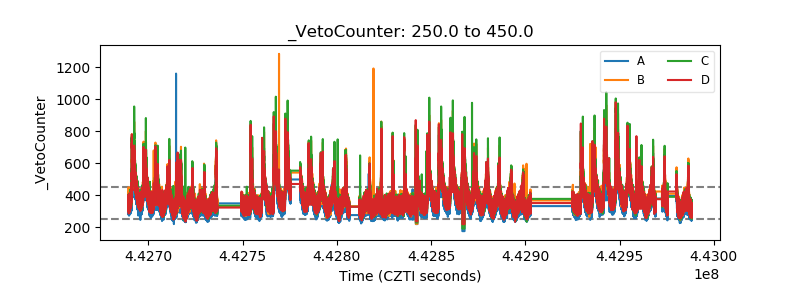 |