| Param | Original file | Final file |
|---|---|---|
| Filename | modeM0/AS1A13_004T13_9000006022cztM0_level2.fits | modeM0/AS1A13_004T13_9000006022cztM0_level2_quad_clean.evt |
| Size (bytes) | 1,194,266,880 | 1,195,894,080 |
| Size | 1.1 GB | 1.1 GB |
| Events in quadrant A | 6,419,012 | 5,897,886 |
| Events in quadrant B | 6,978,432 | 7,486,964 |
| Events in quadrant C | 7,339,310 | 7,371,952 |
| Events in quadrant D | 5,771,740 | 5,825,967 |
| Mode M9 | |||
|---|---|---|---|
| Quadrant | BADHDUFLAG | Total packets | Discarded packets |
| A | 0 | 172 | 0 |
| B | 0 | 172 | 0 |
| C | 0 | 172 | 0 |
| D | 0 | 172 | 0 |
| Mode M0 | |||
|---|---|---|---|
| Quadrant | BADHDUFLAG | Total packets | Discarded packets |
| A | 0 | 621414 | 0 |
| B | 0 | 341109 | 0 |
| C | 0 | 295415 | 0 |
| D | 0 | 505634 | 0 |
| Mode SS | |||
|---|---|---|---|
| Quadrant | BADHDUFLAG | Total packets | Discarded packets |
| A | 0 | 2850 | 0 |
| B | 0 | 2850 | 0 |
| C | 0 | 2850 | 0 |
| D | 0 | 2850 | 0 |
| Quadrant | Total seconds | Saturated seconds | Saturation percentage |
|---|---|---|---|
| A | 140591 | 32274 | 22.955950% |
| B | 140593 | 6016 | 4.279018% |
| C | 140593 | 1385 | 0.985113% |
| D | 140593 | 20583 | 14.640131% |
Noise dominated data is calculated using 1-second bins in cleaned event files. If a bin has >2000 counts, and if more than 50% of those come from <1% of pixels, then it is considered to be noise-dominated and hence unusable.
| Quadrant | # 1 sec bins | Bins with >0 counts | Bins with >2000 counts | High rate bins dominated by noise | Noise dominated (total time) | Noise dominated (detector-on time) | Marked lightcurve |
|---|---|---|---|---|---|---|---|
| A | 157539 | 139553 | 0 | 0 | 0.00% | 0.00% |  |
| B | 157538 | 140541 | 0 | 0 | 0.00% | 0.00% |  |
| C | 157539 | 140576 | 0 | 0 | 0.00% | 0.00% | 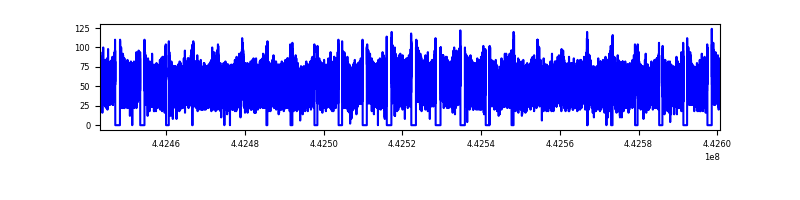 |
| D | 157538 | 139999 | 0 | 0 | 0.00% | 0.00% | 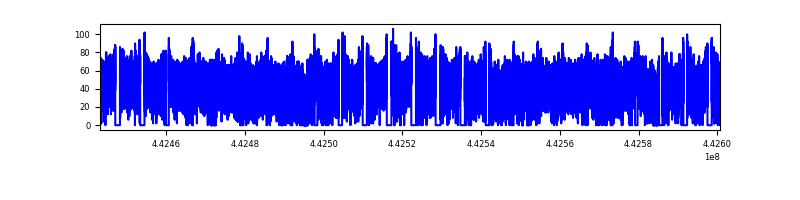 |
Top three noisy pixels from each quadrant. If the there are fewer than three noisy pixels in the level2.evt file, extra rows are filled as -1
| Pixel properties | Quadrant properties | ||||||
|---|---|---|---|---|---|---|---|
| Quadrant | DetID | PixID | Counts | Sigma | Mean | Median | Sigma |
| A | 7 | 110 | 5273 | 8.74 | 1670 | 1557 | 425.3 |
| A | 15 | 236 | 4956 | 7.99 | 1670 | 1557 | 425.3 |
| A | 0 | 29 | 4949 | 7.97 | 1670 | 1557 | 425.3 |
| B | 2 | 9 | 6462 | 13.01 | 1847 | 1756 | 361.8 |
| B | 2 | 8 | 5313 | 9.83 | 1847 | 1756 | 361.8 |
| B | 3 | 17 | 5081 | 9.19 | 1847 | 1756 | 361.8 |
| C | 3 | 202 | 5670 | 7.83 | 1939 | 1805 | 493.6 |
| C | 1 | 81 | 5615 | 7.72 | 1939 | 1805 | 493.6 |
| C | 1 | 80 | 5529 | 7.54 | 1939 | 1805 | 493.6 |
| D | 15 | 47 | 4277 | 6.02 | 1660 | 1506 | 460.1 |
| D | 15 | 63 | 4242 | 5.95 | 1660 | 1506 | 460.1 |
| D | 10 | 189 | 4232 | 5.92 | 1660 | 1506 | 460.1 |
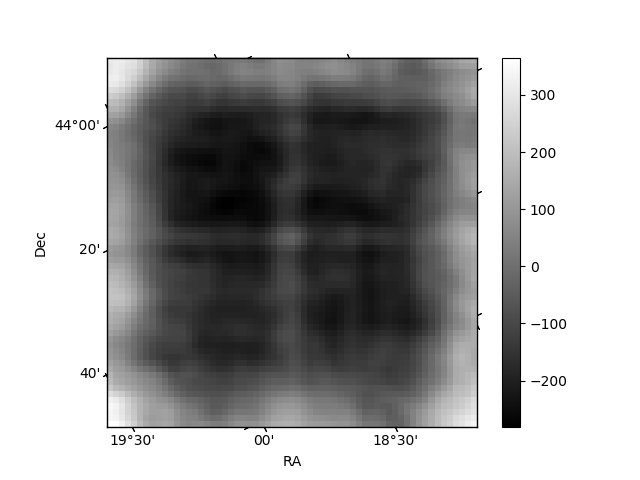
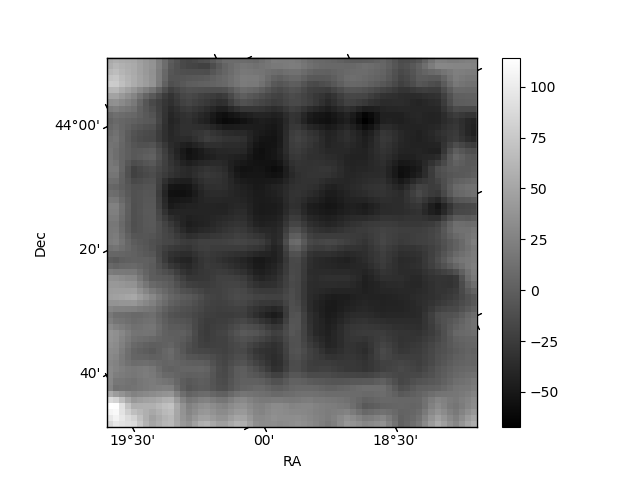
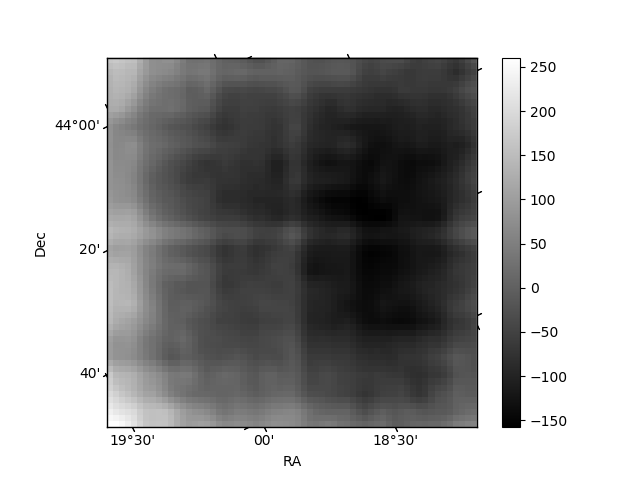
Histogram calculated using DETX and DETY for each event in the final _common_clean file
| Quadrant A |  |
 |
Quadrant B |
|---|---|---|---|
| Quadrant D |  |
 |
Quadrant C |
| Plot type | Count rate plots | Images |
|---|---|---|
| Comparison with Poisson distribution Blue bars denote a histogram of data divided into 1 sec bins. Red curve is a Poisson curve with rate = median count rate of data. |
 |
 |
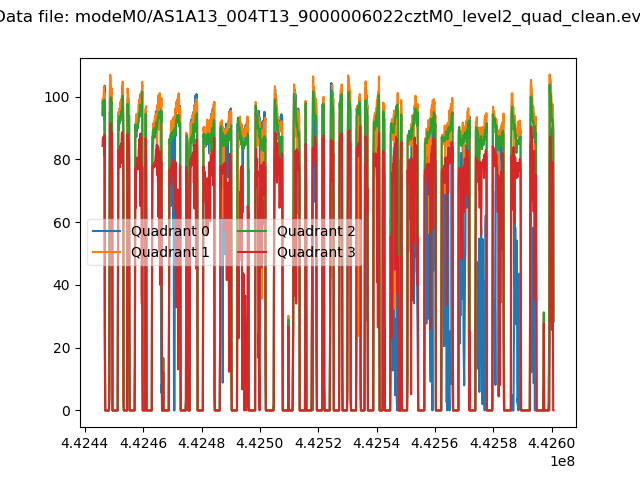
| Quadrant-wise count rates Data is divided into 100 sec bins |
 |
|
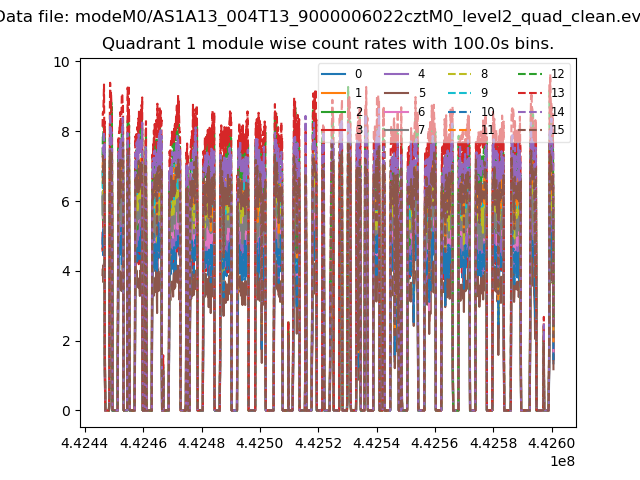
| Module-wise count rates for Quadrant A Data is divided into 100 sec bins |
 |
 |
| Module-wise count rates for Quadrant B Data is divided into 100 sec bins |
 |
 |
| Module-wise count rates for Quadrant C Data is divided into 100 sec bins |
 |
 |
| Module-wise count rates for Quadrant D Data is divided into 100 sec bins |
 |
 |
| Parameter | Plot |
|---|---|
| CZT HV Monitor | 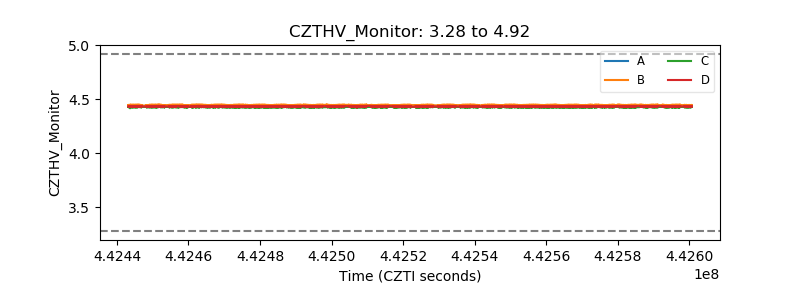 |
| D_VDD |  |
| Temperature 1 | 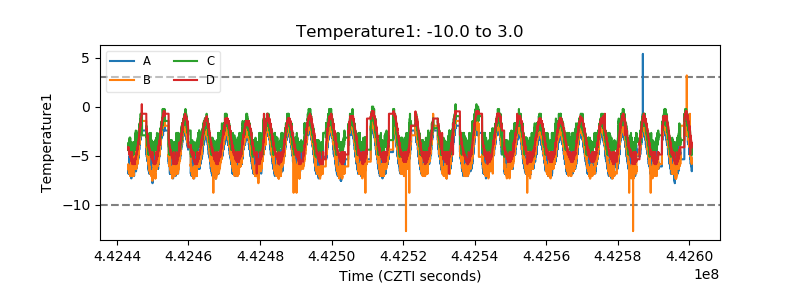 |
| Veto HV Monitor |  |
| Veto LLD |  |
| Alpha Counter |  |
| _CPM_Rate |  |
| CZT Counter |  |
| +2.5 Volts monitor |  |
| +5 Volts monitor |  |
| _ROLL_ROT | 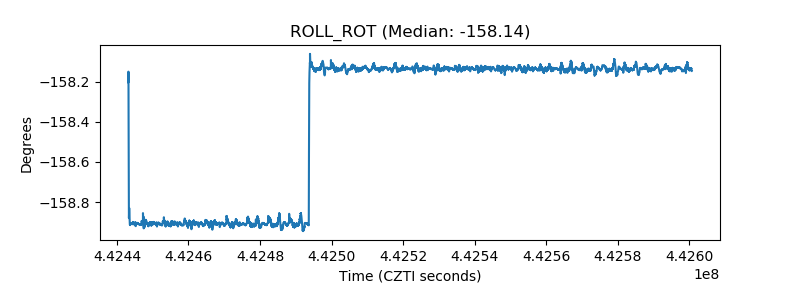 |
| _Roll_DEC | 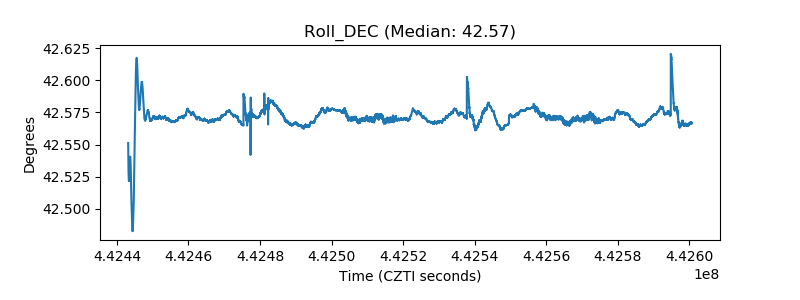 |
| _Roll_RA |  |
| Veto Counter |  |