| Param | Original file | Final file |
|---|---|---|
| Filename | modeM0/AS1A13_004T11_9000006018cztM0_level2.fits | modeM0/AS1A13_004T11_9000006018cztM0_level2_quad_clean.evt |
| Size (bytes) | 1,100,502,720 | 1,091,563,200 |
| Size | 1.0 GB | 1.0 GB |
| Events in quadrant A | 6,449,290 | 6,435,961 |
| Events in quadrant B | 6,351,388 | 6,581,287 |
| Events in quadrant C | 6,639,952 | 6,378,382 |
| Events in quadrant D | 5,159,872 | 4,948,056 |
| Mode SS | |||
|---|---|---|---|
| Quadrant | BADHDUFLAG | Total packets | Discarded packets |
| A | 0 | 2586 | 0 |
| B | 0 | 2586 | 0 |
| C | 0 | 2586 | 0 |
| D | 0 | 2586 | 0 |
| Mode M0 | |||
|---|---|---|---|
| Quadrant | BADHDUFLAG | Total packets | Discarded packets |
| A | 0 | 443389 | 0 |
| B | 0 | 299979 | 0 |
| C | 0 | 275535 | 0 |
| D | 0 | 459440 | 0 |
| Mode M9 | |||
|---|---|---|---|
| Quadrant | BADHDUFLAG | Total packets | Discarded packets |
| A | 0 | 186 | 0 |
| B | 0 | 186 | 0 |
| C | 0 | 186 | 0 |
| D | 0 | 186 | 0 |
| Quadrant | Total seconds | Saturated seconds | Saturation percentage |
|---|---|---|---|
| A | 127142 | 8727 | 6.863979% |
| B | 127144 | 4592 | 3.611653% |
| C | 127144 | 2099 | 1.650884% |
| D | 127144 | 20017 | 15.743566% |
Noise dominated data is calculated using 1-second bins in cleaned event files. If a bin has >2000 counts, and if more than 50% of those come from <1% of pixels, then it is considered to be noise-dominated and hence unusable.
| Quadrant | # 1 sec bins | Bins with >0 counts | Bins with >2000 counts | High rate bins dominated by noise | Noise dominated (total time) | Noise dominated (detector-on time) | Marked lightcurve |
|---|---|---|---|---|---|---|---|
| A | 145739 | 127038 | 0 | 0 | 0.00% | 0.00% |  |
| B | 145739 | 127118 | 0 | 0 | 0.00% | 0.00% |  |
| C | 145739 | 127110 | 0 | 0 | 0.00% | 0.00% |  |
| D | 145740 | 126256 | 0 | 0 | 0.00% | 0.00% | 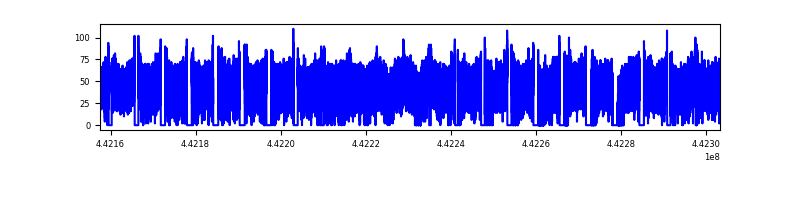 |
Top three noisy pixels from each quadrant. If the there are fewer than three noisy pixels in the level2.evt file, extra rows are filled as -1
| Pixel properties | Quadrant properties | ||||||
|---|---|---|---|---|---|---|---|
| Quadrant | DetID | PixID | Counts | Sigma | Mean | Median | Sigma |
| A | 7 | 110 | 5264 | 8.63 | 1680 | 1566 | 428.6 |
| A | 0 | 29 | 5184 | 8.44 | 1680 | 1566 | 428.6 |
| A | 15 | 236 | 5070 | 8.18 | 1680 | 1566 | 428.6 |
| B | 2 | 9 | 5908 | 13.12 | 1682 | 1600 | 328.3 |
| B | 2 | 8 | 4762 | 9.63 | 1682 | 1600 | 328.3 |
| B | 3 | 17 | 4609 | 9.17 | 1682 | 1600 | 328.3 |
| C | 3 | 202 | 5186 | 7.86 | 1756 | 1634 | 452.0 |
| C | 1 | 81 | 5178 | 7.84 | 1756 | 1634 | 452.0 |
| C | 3 | 203 | 5046 | 7.55 | 1756 | 1634 | 452.0 |
| D | 8 | 176 | 5104 | 9.16 | 1481 | 1342 | 410.8 |
| D | 15 | 47 | 3809 | 6.01 | 1481 | 1342 | 410.8 |
| D | 15 | 63 | 3783 | 5.94 | 1481 | 1342 | 410.8 |
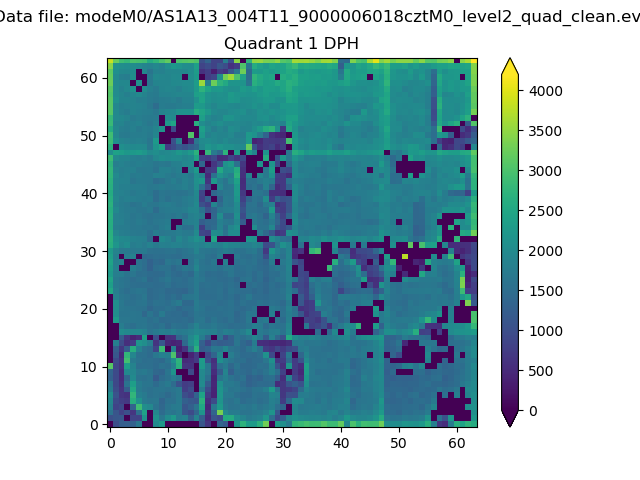
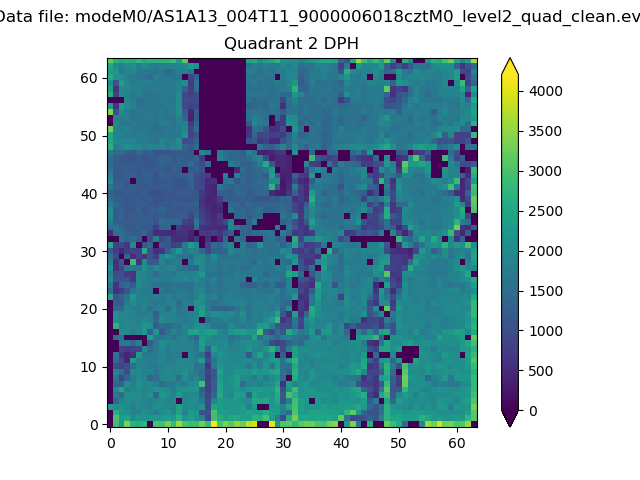
Histogram calculated using DETX and DETY for each event in the final _common_clean file
| Quadrant A |  |
 |
Quadrant B |
|---|---|---|---|
| Quadrant D |  |
 |
Quadrant C |
| Plot type | Count rate plots | Images |
|---|---|---|
| Comparison with Poisson distribution Blue bars denote a histogram of data divided into 1 sec bins. Red curve is a Poisson curve with rate = median count rate of data. |
 |
 |
| Quadrant-wise count rates Data is divided into 100 sec bins |
 |
|
| Module-wise count rates for Quadrant A Data is divided into 100 sec bins |
 |
 |
| Module-wise count rates for Quadrant B Data is divided into 100 sec bins |
 |
 |
| Module-wise count rates for Quadrant C Data is divided into 100 sec bins |
 |
 |
| Module-wise count rates for Quadrant D Data is divided into 100 sec bins |
 |
 |
| Parameter | Plot |
|---|---|
| CZT HV Monitor |  |
| D_VDD |  |
| Temperature 1 |  |
| Veto HV Monitor |  |
| Veto LLD | 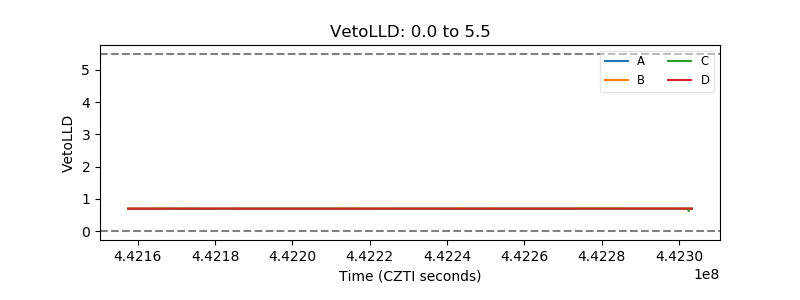 |
| Alpha Counter |  |
| _CPM_Rate |  |
| CZT Counter |  |
| +2.5 Volts monitor |  |
| +5 Volts monitor |  |
| _ROLL_ROT |  |
| _Roll_DEC |  |
| _Roll_RA |  |
| Veto Counter |  |