| Param | Original file | Final file |
|---|---|---|
| Filename | modeM0/AS1A13_009T01_9000006016cztM0_level2.fits | modeM0/AS1A13_009T01_9000006016cztM0_level2_quad_clean.evt |
| Size (bytes) | 424,797,120 | 449,084,160 |
| Size | 405.1 MB | 428.3 MB |
| Events in quadrant A | 2,444,360 | 2,582,686 |
| Events in quadrant B | 2,489,816 | 2,804,252 |
| Events in quadrant C | 2,609,402 | 2,724,751 |
| Events in quadrant D | 2,009,536 | 2,183,813 |
| Mode M9 | |||
|---|---|---|---|
| Quadrant | BADHDUFLAG | Total packets | Discarded packets |
| A | 0 | 65 | 0 |
| B | 0 | 65 | 0 |
| C | 0 | 65 | 0 |
| D | 0 | 65 | 0 |
| Mode SS | |||
|---|---|---|---|
| Quadrant | BADHDUFLAG | Total packets | Discarded packets |
| A | 0 | 980 | 0 |
| B | 0 | 980 | 0 |
| C | 0 | 980 | 0 |
| D | 0 | 980 | 0 |
| Mode M0 | |||
|---|---|---|---|
| Quadrant | BADHDUFLAG | Total packets | Discarded packets |
| A | 0 | 184955 | 0 |
| B | 0 | 114459 | 0 |
| C | 0 | 100458 | 0 |
| D | 0 | 208789 | 0 |
| Quadrant | Total seconds | Saturated seconds | Saturation percentage |
|---|---|---|---|
| A | 48134 | 6437 | 13.373083% |
| B | 48134 | 1633 | 3.392612% |
| C | 48134 | 304 | 0.631570% |
| D | 48134 | 8981 | 18.658329% |
Noise dominated data is calculated using 1-second bins in cleaned event files. If a bin has >2000 counts, and if more than 50% of those come from <1% of pixels, then it is considered to be noise-dominated and hence unusable.
| Quadrant | # 1 sec bins | Bins with >0 counts | Bins with >2000 counts | High rate bins dominated by noise | Noise dominated (total time) | Noise dominated (detector-on time) | Marked lightcurve |
|---|---|---|---|---|---|---|---|
| A | 54739 | 48117 | 0 | 0 | 0.00% | 0.00% |  |
| B | 54739 | 48128 | 0 | 0 | 0.00% | 0.00% |  |
| C | 54739 | 48134 | 0 | 0 | 0.00% | 0.00% |  |
| D | 54739 | 48084 | 0 | 0 | 0.00% | 0.00% | 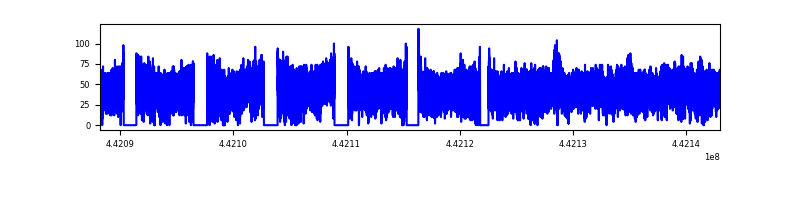 |
Top three noisy pixels from each quadrant. If the there are fewer than three noisy pixels in the level2.evt file, extra rows are filled as -1
| Pixel properties | Quadrant properties | ||||||
|---|---|---|---|---|---|---|---|
| Quadrant | DetID | PixID | Counts | Sigma | Mean | Median | Sigma |
| A | 0 | 29 | 2000 | 8.59 | 637 | 595 | 163.6 |
| A | 7 | 110 | 1997 | 8.57 | 637 | 595 | 163.6 |
| A | 14 | 95 | 1940 | 8.22 | 637 | 595 | 163.6 |
| B | 2 | 9 | 2349 | 12.96 | 659 | 625 | 133.1 |
| B | 2 | 8 | 1852 | 9.22 | 659 | 625 | 133.1 |
| B | 3 | 17 | 1802 | 8.85 | 659 | 625 | 133.1 |
| C | 3 | 202 | 1968 | 7.45 | 689 | 640 | 178.2 |
| C | 1 | 81 | 1955 | 7.38 | 689 | 640 | 178.2 |
| C | 3 | 203 | 1922 | 7.19 | 689 | 640 | 178.2 |
| D | 8 | 176 | 2068 | 9.54 | 576 | 522 | 162.1 |
| D | 8 | 192 | 1481 | 5.92 | 576 | 522 | 162.1 |
| D | 4 | 16 | 1465 | 5.82 | 576 | 522 | 162.1 |
Histogram calculated using DETX and DETY for each event in the final _common_clean file
| Quadrant A |  |
 |
Quadrant B |
|---|---|---|---|
| Quadrant D | 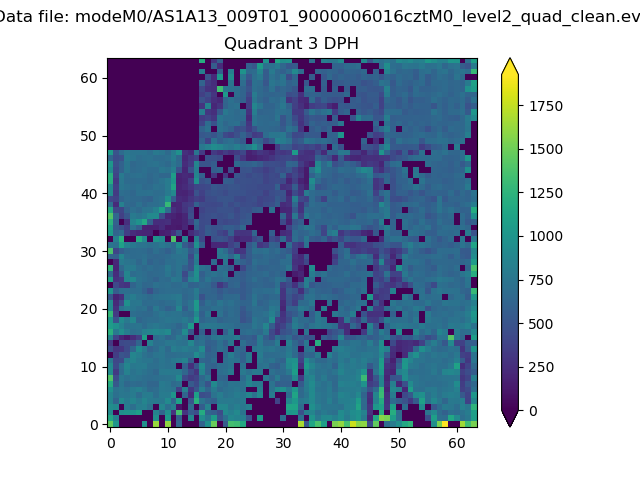 |
 |
Quadrant C |
| Plot type | Count rate plots | Images |
|---|---|---|
| Comparison with Poisson distribution Blue bars denote a histogram of data divided into 1 sec bins. Red curve is a Poisson curve with rate = median count rate of data. |
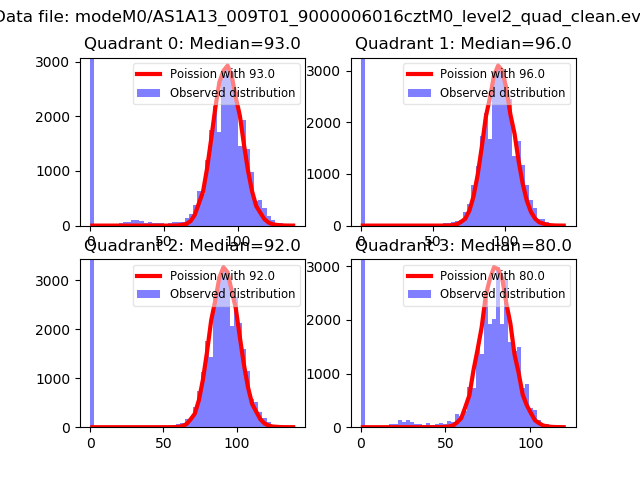 |
 |
| Quadrant-wise count rates Data is divided into 100 sec bins |
 |
|
| Module-wise count rates for Quadrant A Data is divided into 100 sec bins |
 |
 |
| Module-wise count rates for Quadrant B Data is divided into 100 sec bins |
 |
 |
| Module-wise count rates for Quadrant C Data is divided into 100 sec bins |
 |
 |
| Module-wise count rates for Quadrant D Data is divided into 100 sec bins |
 |
 |
| Parameter | Plot |
|---|---|
| CZT HV Monitor |  |
| D_VDD |  |
| Temperature 1 | 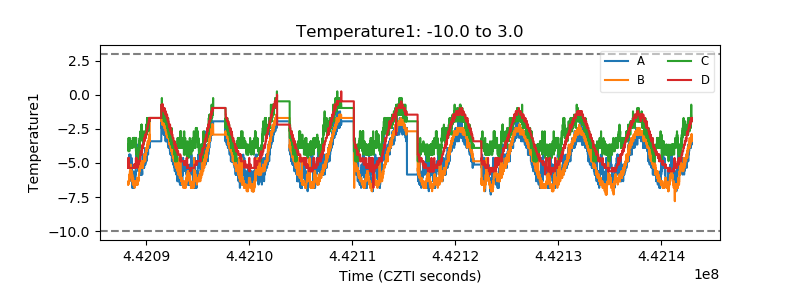 |
| Veto HV Monitor |  |
| Veto LLD |  |
| Alpha Counter | 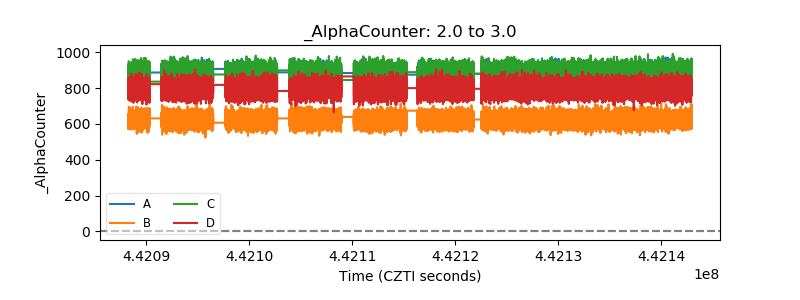 |
| _CPM_Rate | 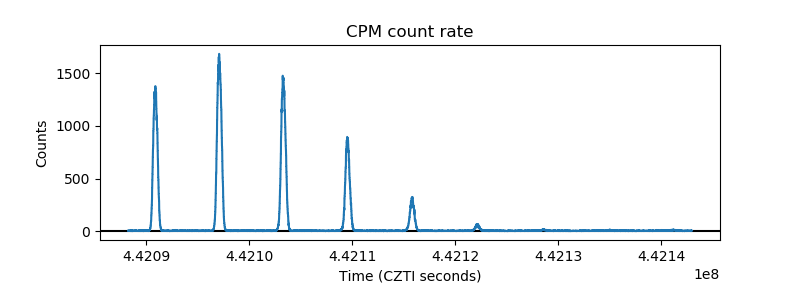 |
| CZT Counter |  |
| +2.5 Volts monitor |  |
| +5 Volts monitor | 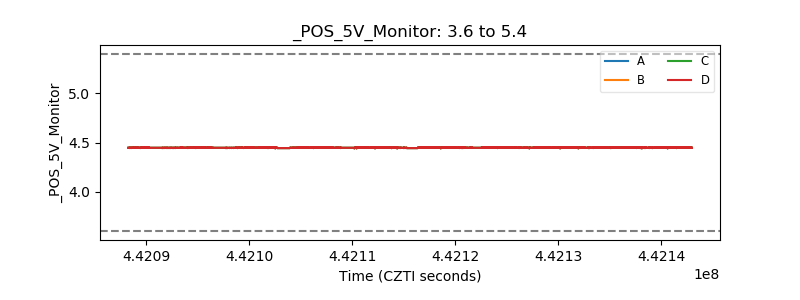 |
| _ROLL_ROT |  |
| _Roll_DEC |  |
| _Roll_RA | 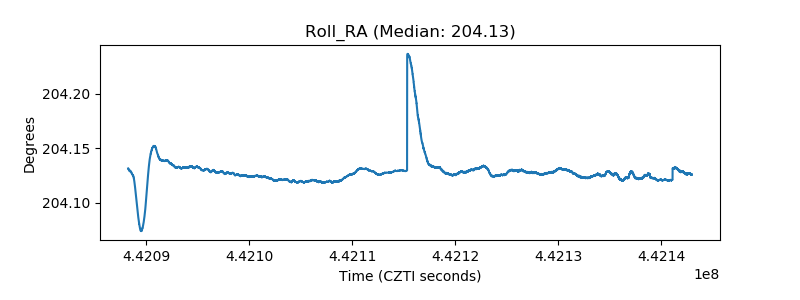 |
| Veto Counter | 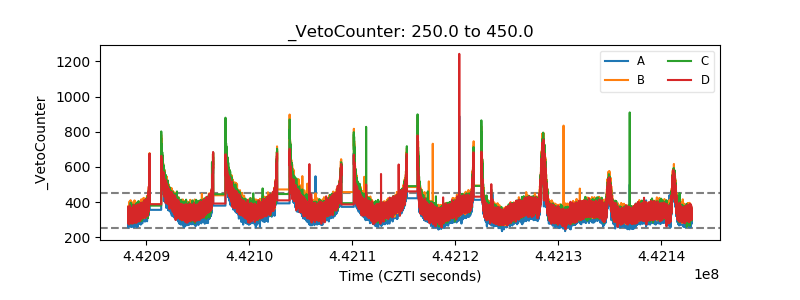 |