| Param | Original file | Final file |
|---|---|---|
| Filename | modeM0/AS1A13_072T01_9000006008cztM0_level2.fits | modeM0/AS1A13_072T01_9000006008cztM0_level2_quad_clean.evt |
| Size (bytes) | 2,566,319,040 | 3,016,759,680 |
| Size | 2.4 GB | 2.8 GB |
| Events in quadrant A | 15,056,598 | 18,534,116 |
| Events in quadrant B | 14,866,050 | 19,017,986 |
| Events in quadrant C | 15,203,914 | 18,086,063 |
| Events in quadrant D | 12,409,592 | 15,565,922 |
| Mode M0 | |||
|---|---|---|---|
| Quadrant | BADHDUFLAG | Total packets | Discarded packets |
| A | 0 | 912637 | 0 |
| B | 0 | 637472 | 0 |
| C | 0 | 652872 | 0 |
| D | 0 | 928514 | 0 |
| Mode SS | |||
|---|---|---|---|
| Quadrant | BADHDUFLAG | Total packets | Discarded packets |
| A | 0 | 5970 | 0 |
| B | 0 | 5970 | 0 |
| C | 0 | 5970 | 0 |
| D | 0 | 5970 | 0 |
| Mode M9 | |||
|---|---|---|---|
| Quadrant | BADHDUFLAG | Total packets | Discarded packets |
| A | 0 | 375 | 0 |
| B | 0 | 376 | 0 |
| C | 0 | 377 | 0 |
| D | 0 | 377 | 0 |
| Quadrant | Total seconds | Saturated seconds | Saturation percentage |
|---|---|---|---|
| A | 294476 | 8814 | 2.993113% |
| B | 294479 | 5214 | 1.770585% |
| C | 294480 | 4191 | 1.423187% |
| D | 294478 | 27220 | 9.243475% |
Noise dominated data is calculated using 1-second bins in cleaned event files. If a bin has >2000 counts, and if more than 50% of those come from <1% of pixels, then it is considered to be noise-dominated and hence unusable.
| Quadrant | # 1 sec bins | Bins with >0 counts | Bins with >2000 counts | High rate bins dominated by noise | Noise dominated (total time) | Noise dominated (detector-on time) | Marked lightcurve |
|---|---|---|---|---|---|---|---|
| A | 377133 | 294358 | 0 | 0 | 0.00% | 0.00% |  |
| B | 377132 | 294456 | 0 | 0 | 0.00% | 0.00% | 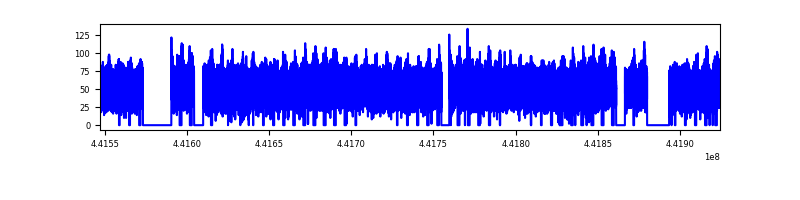 |
| C | 377134 | 294436 | 0 | 0 | 0.00% | 0.00% | 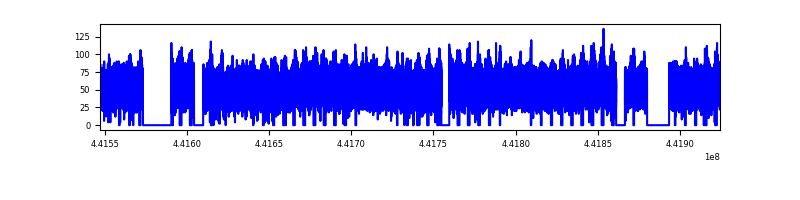 |
| D | 377134 | 293882 | 0 | 0 | 0.00% | 0.00% | 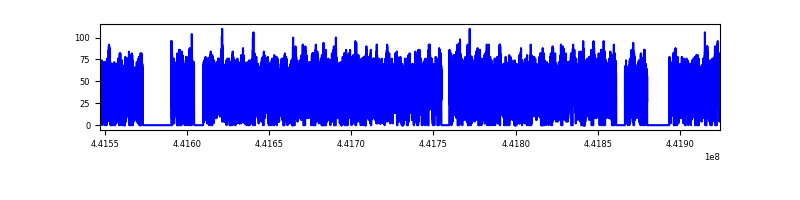 |
Top three noisy pixels from each quadrant. If the there are fewer than three noisy pixels in the level2.evt file, extra rows are filled as -1
| Pixel properties | Quadrant properties | ||||||
|---|---|---|---|---|---|---|---|
| Quadrant | DetID | PixID | Counts | Sigma | Mean | Median | Sigma |
| A | 7 | 110 | 12404 | 8.75 | 3927 | 3668 | 998.9 |
| A | 15 | 236 | 11808 | 8.15 | 3927 | 3668 | 998.9 |
| A | 0 | 29 | 11738 | 8.08 | 3927 | 3668 | 998.9 |
| B | 2 | 9 | 13743 | 13.04 | 3925 | 3734 | 767.5 |
| B | 2 | 8 | 11286 | 9.84 | 3925 | 3734 | 767.5 |
| B | 3 | 17 | 10421 | 8.71 | 3925 | 3734 | 767.5 |
| C | 3 | 202 | 11884 | 7.94 | 4019 | 3741 | 1025.4 |
| C | 1 | 81 | 11789 | 7.85 | 4019 | 3741 | 1025.4 |
| C | 1 | 80 | 11591 | 7.66 | 4019 | 3741 | 1025.4 |
| D | 8 | 176 | 12279 | 9.12 | 3561 | 3228 | 992.6 |
| D | 10 | 189 | 9172 | 5.99 | 3561 | 3228 | 992.6 |
| D | 15 | 47 | 9130 | 5.95 | 3561 | 3228 | 992.6 |
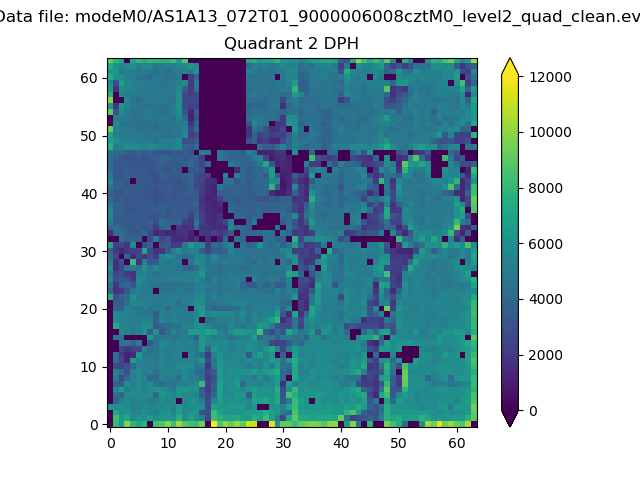
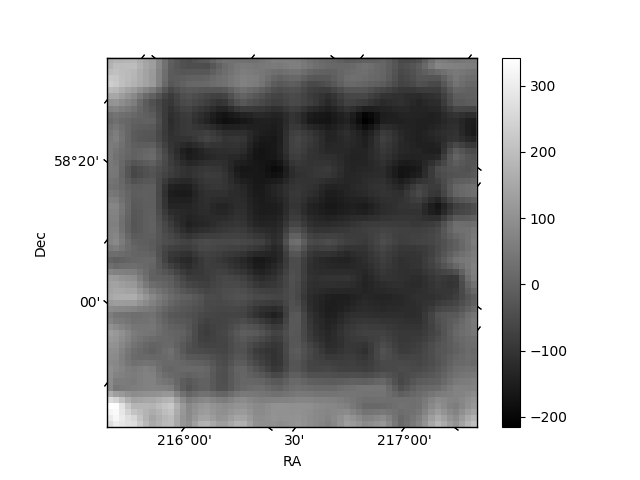
Histogram calculated using DETX and DETY for each event in the final _common_clean file
| Quadrant A |  |
 |
Quadrant B |
|---|---|---|---|
| Quadrant D |  |
 |
Quadrant C |
| Plot type | Count rate plots | Images |
|---|---|---|
| Comparison with Poisson distribution Blue bars denote a histogram of data divided into 1 sec bins. Red curve is a Poisson curve with rate = median count rate of data. |
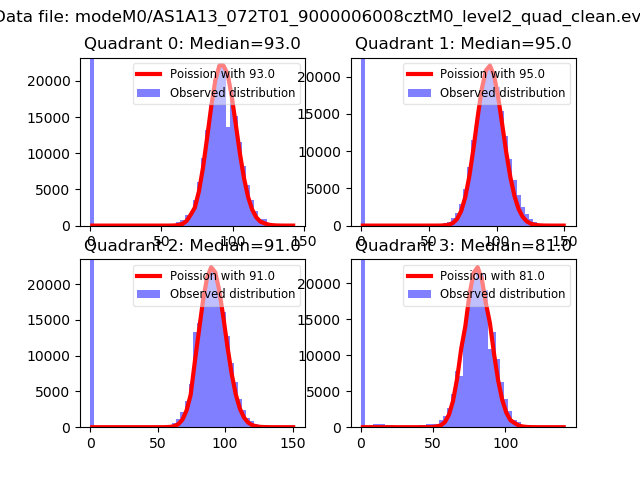 |
 |
| Quadrant-wise count rates Data is divided into 100 sec bins |
 |
|
| Module-wise count rates for Quadrant A Data is divided into 100 sec bins |
 |
 |
| Module-wise count rates for Quadrant B Data is divided into 100 sec bins |
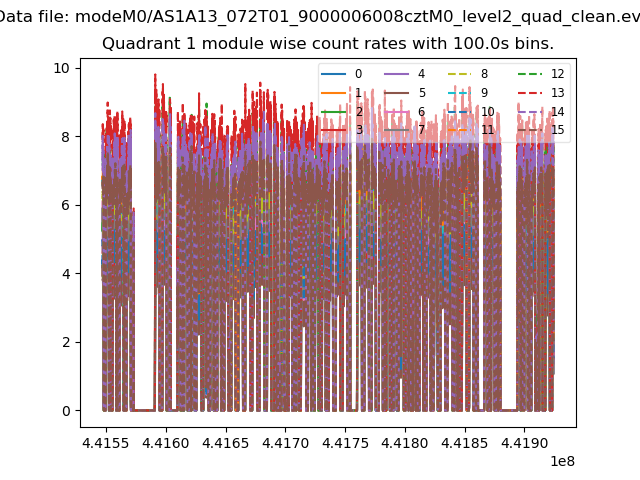 |
 |
| Module-wise count rates for Quadrant C Data is divided into 100 sec bins |
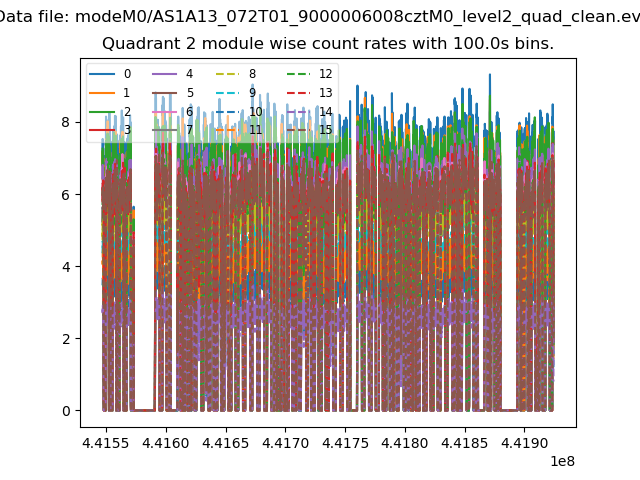 |
 |
| Module-wise count rates for Quadrant D Data is divided into 100 sec bins |
 |
 |
| Parameter | Plot |
|---|---|
| CZT HV Monitor |  |
| D_VDD | 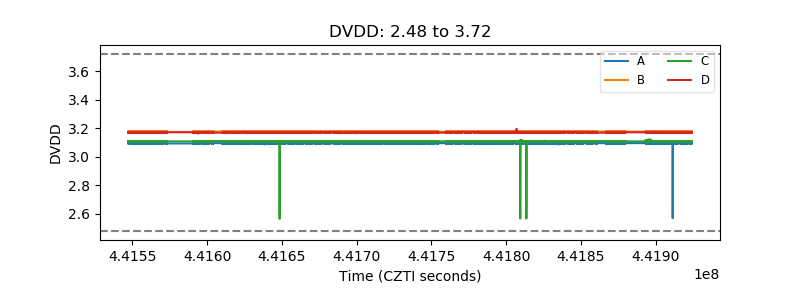 |
| Temperature 1 |  |
| Veto HV Monitor |  |
| Veto LLD | 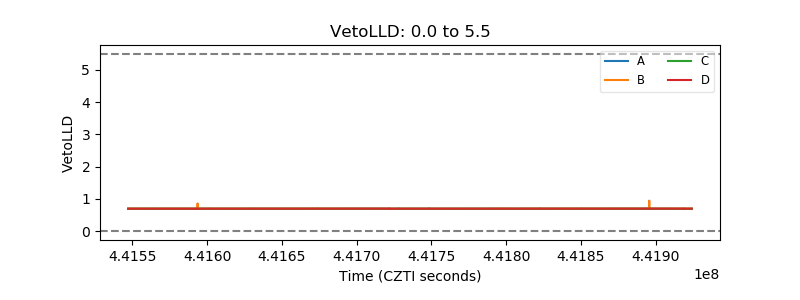 |
| Alpha Counter |  |
| _CPM_Rate |  |
| CZT Counter |  |
| +2.5 Volts monitor |  |
| +5 Volts monitor | 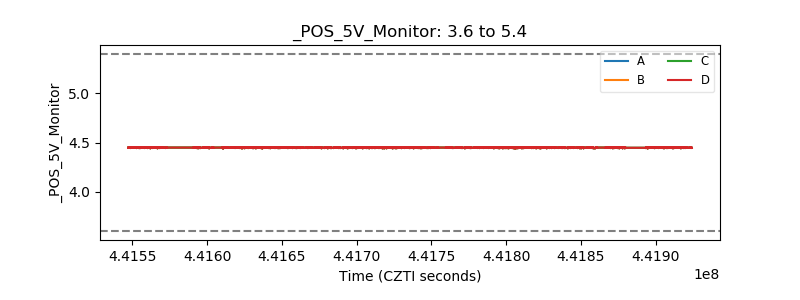 |
| _ROLL_ROT |  |
| _Roll_DEC |  |
| _Roll_RA | 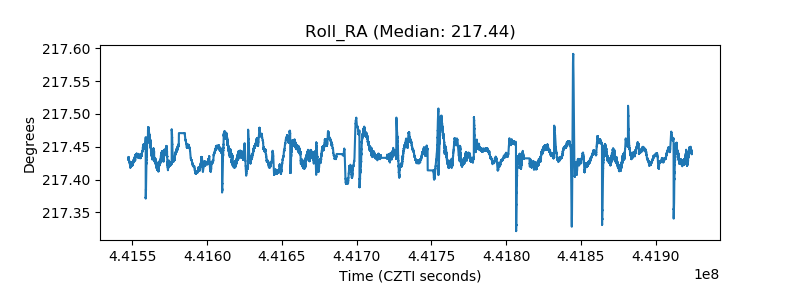 |
| Veto Counter |  |