| Param | Original file | Final file |
|---|---|---|
| Filename | modeM0/AS1A13_003T01_9000006002cztM0_level2.fits | modeM0/AS1A13_003T01_9000006002cztM0_level2_quad_clean.evt |
| Size (bytes) | 1,181,514,240 | 1,261,840,320 |
| Size | 1.1 GB | 1.2 GB |
| Events in quadrant A | 7,042,692 | 7,680,897 |
| Events in quadrant B | 6,812,824 | 7,772,617 |
| Events in quadrant C | 6,929,822 | 7,283,624 |
| Events in quadrant D | 5,881,354 | 6,372,842 |
| Mode M9 | |||
|---|---|---|---|
| Quadrant | BADHDUFLAG | Total packets | Discarded packets |
| A | 0 | 163 | 0 |
| B | 0 | 165 | 0 |
| C | 0 | 165 | 0 |
| D | 0 | 165 | 0 |
| Mode SS | |||
|---|---|---|---|
| Quadrant | BADHDUFLAG | Total packets | Discarded packets |
| A | 0 | 2688 | 0 |
| B | 0 | 2688 | 0 |
| C | 0 | 2688 | 0 |
| D | 0 | 2688 | 0 |
| Mode M0 | |||
|---|---|---|---|
| Quadrant | BADHDUFLAG | Total packets | Discarded packets |
| A | 0 | 424950 | 0 |
| B | 0 | 308594 | 0 |
| C | 0 | 329136 | 0 |
| D | 0 | 397083 | 0 |
| Quadrant | Total seconds | Saturated seconds | Saturation percentage |
|---|---|---|---|
| A | 132907 | 4986 | 3.751495% |
| B | 132907 | 4647 | 3.496430% |
| C | 132908 | 5001 | 3.762753% |
| D | 132907 | 9628 | 7.244163% |
Noise dominated data is calculated using 1-second bins in cleaned event files. If a bin has >2000 counts, and if more than 50% of those come from <1% of pixels, then it is considered to be noise-dominated and hence unusable.
| Quadrant | # 1 sec bins | Bins with >0 counts | Bins with >2000 counts | High rate bins dominated by noise | Noise dominated (total time) | Noise dominated (detector-on time) | Marked lightcurve |
|---|---|---|---|---|---|---|---|
| A | 254141 | 132895 | 0 | 0 | 0.00% | 0.00% |  |
| B | 254141 | 132809 | 0 | 0 | 0.00% | 0.00% | 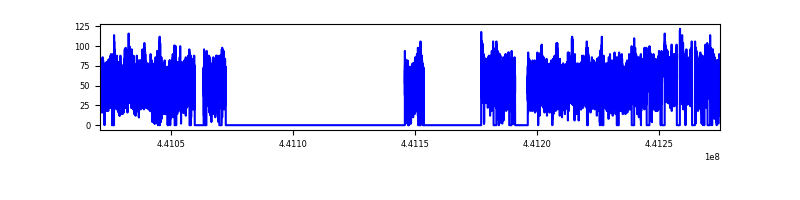 |
| C | 254141 | 132809 | 0 | 0 | 0.00% | 0.00% |  |
| D | 254142 | 132646 | 0 | 0 | 0.00% | 0.00% |  |
Top three noisy pixels from each quadrant. If the there are fewer than three noisy pixels in the level2.evt file, extra rows are filled as -1
| Pixel properties | Quadrant properties | ||||||
|---|---|---|---|---|---|---|---|
| Quadrant | DetID | PixID | Counts | Sigma | Mean | Median | Sigma |
| A | 7 | 110 | 5752 | 8.71 | 1834 | 1713 | 463.8 |
| A | 0 | 29 | 5550 | 8.27 | 1834 | 1713 | 463.8 |
| A | 15 | 236 | 5444 | 8.04 | 1834 | 1713 | 463.8 |
| B | 2 | 9 | 6560 | 13.68 | 1802 | 1714 | 354.2 |
| B | 2 | 8 | 5160 | 9.73 | 1802 | 1714 | 354.2 |
| B | 3 | 17 | 4882 | 8.94 | 1802 | 1714 | 354.2 |
| C | 3 | 202 | 5460 | 7.96 | 1834 | 1707 | 471.3 |
| C | 3 | 203 | 5271 | 7.56 | 1834 | 1707 | 471.3 |
| C | 1 | 81 | 5243 | 7.5 | 1834 | 1707 | 471.3 |
| D | 8 | 176 | 5612 | 8.68 | 1688 | 1533 | 469.9 |
| D | 10 | 189 | 4433 | 6.17 | 1688 | 1533 | 469.9 |
| D | 8 | 192 | 4357 | 6.01 | 1688 | 1533 | 469.9 |
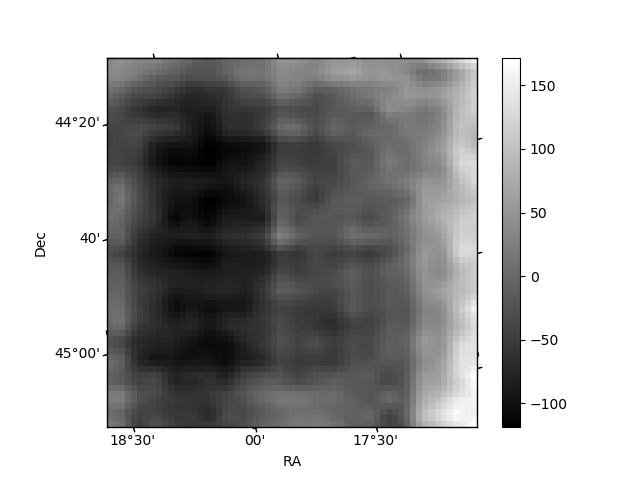
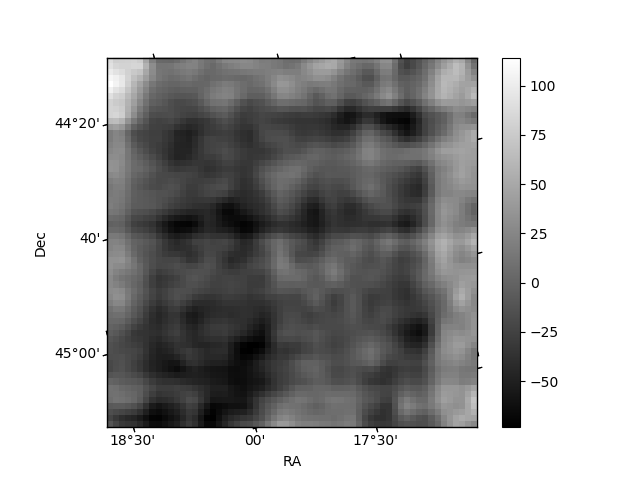
Histogram calculated using DETX and DETY for each event in the final _common_clean file
| Quadrant A | 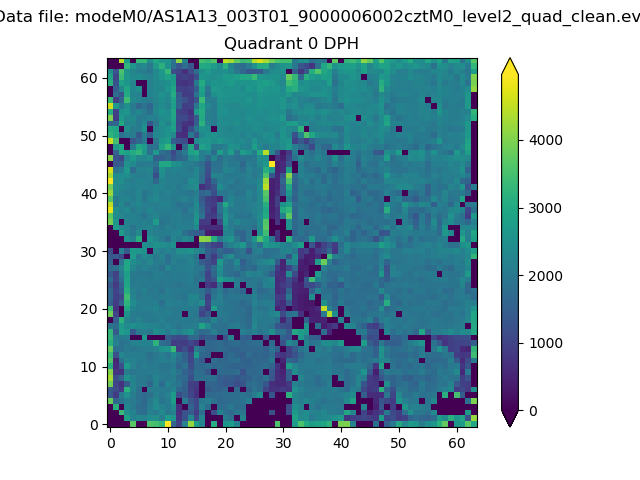 |
 |
Quadrant B |
|---|---|---|---|
| Quadrant D |  |
 |
Quadrant C |
| Plot type | Count rate plots | Images |
|---|---|---|
| Comparison with Poisson distribution Blue bars denote a histogram of data divided into 1 sec bins. Red curve is a Poisson curve with rate = median count rate of data. |
 |
 |
| Quadrant-wise count rates Data is divided into 100 sec bins |
 |
|
| Module-wise count rates for Quadrant A Data is divided into 100 sec bins |
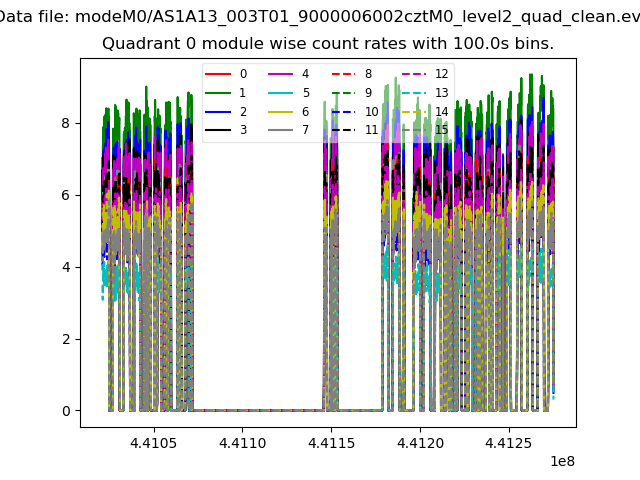 |
 |
| Module-wise count rates for Quadrant B Data is divided into 100 sec bins |
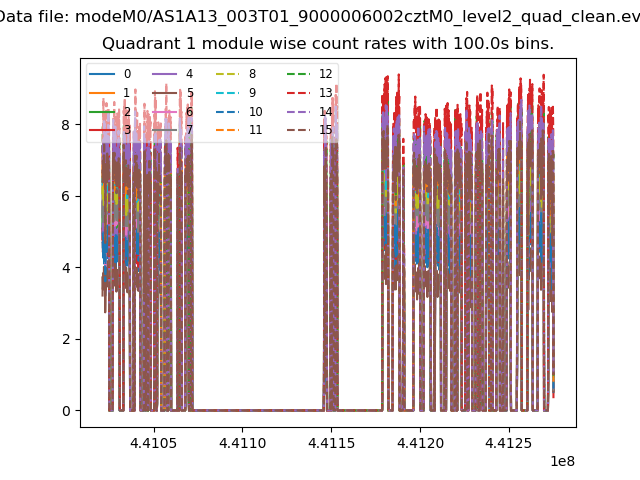 |
 |
| Module-wise count rates for Quadrant C Data is divided into 100 sec bins |
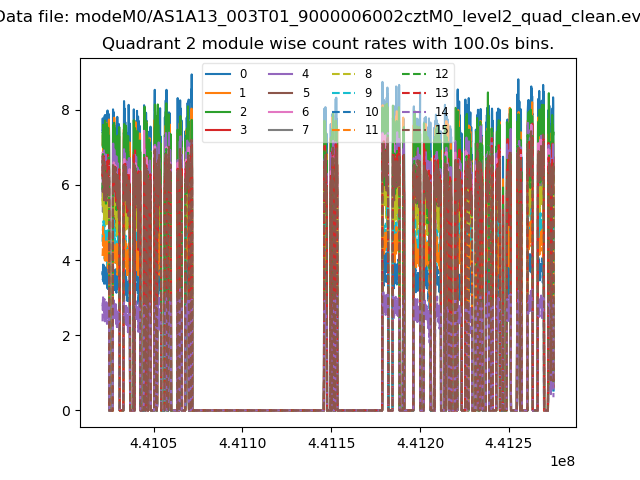 |
 |
| Module-wise count rates for Quadrant D Data is divided into 100 sec bins |
 |
 |
| Parameter | Plot |
|---|---|
| CZT HV Monitor |  |
| D_VDD |  |
| Temperature 1 |  |
| Veto HV Monitor |  |
| Veto LLD |  |
| Alpha Counter | 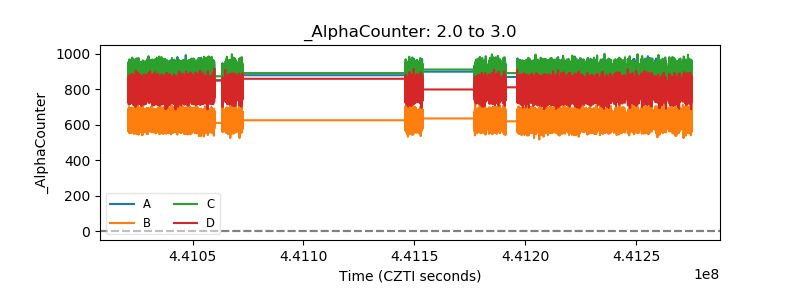 |
| _CPM_Rate | 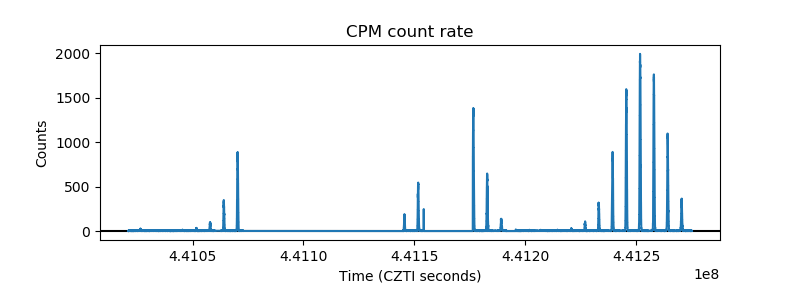 |
| CZT Counter |  |
| +2.5 Volts monitor |  |
| +5 Volts monitor |  |
| _ROLL_ROT |  |
| _Roll_DEC |  |
| _Roll_RA |  |
| Veto Counter |  |