| Param | Original file | Final file |
|---|---|---|
| Filename | modeM0/AS1A13_072T03_9000006000cztM0_level2.fits | modeM0/AS1A13_072T03_9000006000cztM0_level2_quad_clean.evt |
| Size (bytes) | 2,072,635,200 | 2,083,487,040 |
| Size | 1.9 GB | 1.9 GB |
| Events in quadrant A | 12,335,391 | 12,411,218 |
| Events in quadrant B | 11,885,116 | 12,414,993 |
| Events in quadrant C | 12,266,314 | 11,964,244 |
| Events in quadrant D | 10,249,746 | 10,292,342 |
| Mode SS | |||
|---|---|---|---|
| Quadrant | BADHDUFLAG | Total packets | Discarded packets |
| A | 0 | 4757 | 0 |
| B | 0 | 4751 | 0 |
| C | 0 | 4778 | 0 |
| D | 0 | 4772 | 0 |
| Mode M9 | |||
|---|---|---|---|
| Quadrant | BADHDUFLAG | Total packets | Discarded packets |
| A | 0 | 324 | 0 |
| B | 0 | 324 | 0 |
| C | 0 | 325 | 0 |
| D | 0 | 324 | 0 |
| Mode M0 | |||
|---|---|---|---|
| Quadrant | BADHDUFLAG | Total packets | Discarded packets |
| A | 0 | 674899 | 0 |
| B | 0 | 534991 | 0 |
| C | 0 | 540350 | 0 |
| D | 0 | 676124 | 0 |
| Quadrant | Total seconds | Saturated seconds | Saturation percentage |
|---|---|---|---|
| A | 233628 | 4806 | 2.057116% |
| B | 234055 | 9025 | 3.855931% |
| C | 233957 | 6218 | 2.657753% |
| D | 233574 | 17934 | 7.678081% |
Noise dominated data is calculated using 1-second bins in cleaned event files. If a bin has >2000 counts, and if more than 50% of those come from <1% of pixels, then it is considered to be noise-dominated and hence unusable.
| Quadrant | # 1 sec bins | Bins with >0 counts | Bins with >2000 counts | High rate bins dominated by noise | Noise dominated (total time) | Noise dominated (detector-on time) | Marked lightcurve |
|---|---|---|---|---|---|---|---|
| A | 474582 | 234864 | 0 | 0 | 0.00% | 0.00% |  |
| B | 474581 | 235210 | 0 | 0 | 0.00% | 0.00% |  |
| C | 474581 | 235220 | 0 | 0 | 0.00% | 0.00% |  |
| D | 474581 | 234647 | 0 | 0 | 0.00% | 0.00% |  |
Top three noisy pixels from each quadrant. If the there are fewer than three noisy pixels in the level2.evt file, extra rows are filled as -1
| Pixel properties | Quadrant properties | ||||||
|---|---|---|---|---|---|---|---|
| Quadrant | DetID | PixID | Counts | Sigma | Mean | Median | Sigma |
| A | 7 | 110 | 10244 | 8.99 | 3213 | 2996 | 806.6 |
| A | 0 | 29 | 9705 | 8.32 | 3213 | 2996 | 806.6 |
| A | 7 | 109 | 9501 | 8.06 | 3213 | 2996 | 806.6 |
| B | 2 | 9 | 11044 | 13.12 | 3138 | 2976 | 615.1 |
| B | 2 | 8 | 8813 | 9.49 | 3138 | 2976 | 615.1 |
| B | 3 | 17 | 8644 | 9.21 | 3138 | 2976 | 615.1 |
| C | 1 | 81 | 9465 | 7.84 | 3245 | 3010 | 823.5 |
| C | 3 | 202 | 9353 | 7.7 | 3245 | 3010 | 823.5 |
| C | 1 | 80 | 9226 | 7.55 | 3245 | 3010 | 823.5 |
| D | 10 | 189 | 7518 | 5.92 | 2946 | 2665 | 819.3 |
| D | 7 | 3 | 7438 | 5.82 | 2946 | 2665 | 819.3 |
| D | 4 | 16 | 7387 | 5.76 | 2946 | 2665 | 819.3 |
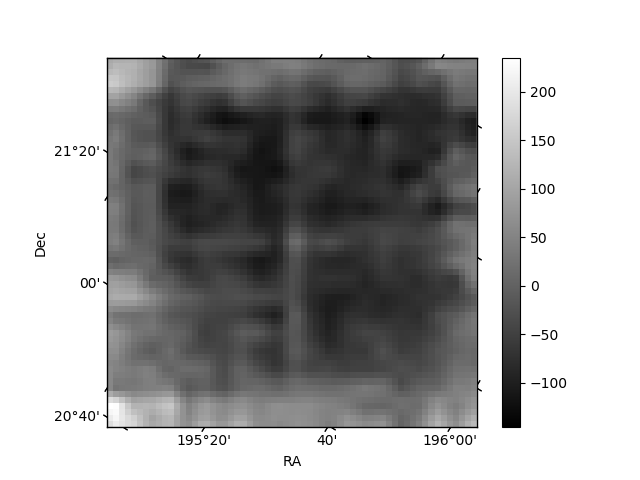
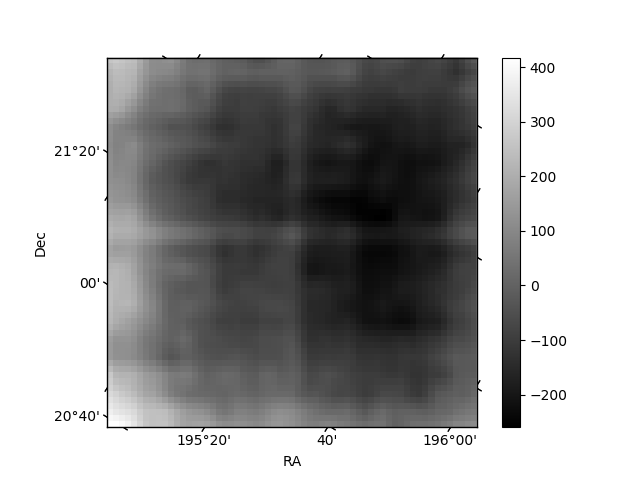
Histogram calculated using DETX and DETY for each event in the final _common_clean file
| Quadrant A |  |
 |
Quadrant B |
|---|---|---|---|
| Quadrant D |  |
 |
Quadrant C |
| Plot type | Count rate plots | Images |
|---|---|---|
| Comparison with Poisson distribution Blue bars denote a histogram of data divided into 1 sec bins. Red curve is a Poisson curve with rate = median count rate of data. |
 |
 |
| Quadrant-wise count rates Data is divided into 100 sec bins |
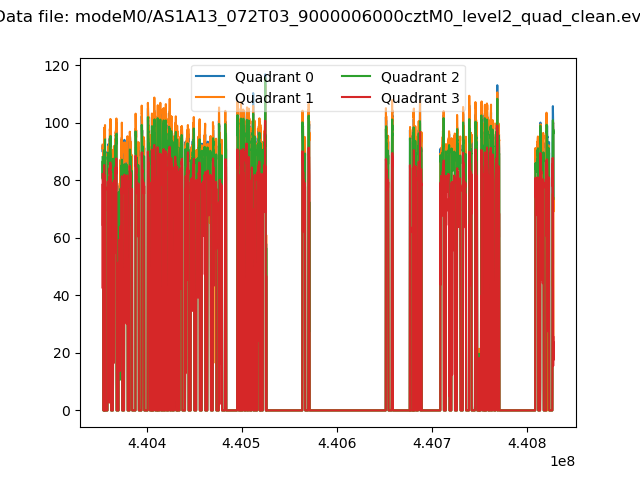 |
|
| Module-wise count rates for Quadrant A Data is divided into 100 sec bins |
 |
 |
| Module-wise count rates for Quadrant B Data is divided into 100 sec bins |
 |
 |
| Module-wise count rates for Quadrant C Data is divided into 100 sec bins |
 |
 |
| Module-wise count rates for Quadrant D Data is divided into 100 sec bins |
 |
 |
| Parameter | Plot |
|---|---|
| CZT HV Monitor |  |
| D_VDD |  |
| Temperature 1 | 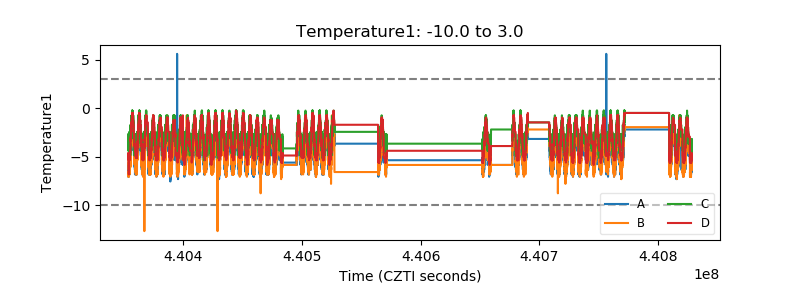 |
| Veto HV Monitor |  |
| Veto LLD |  |
| Alpha Counter |  |
| _CPM_Rate | 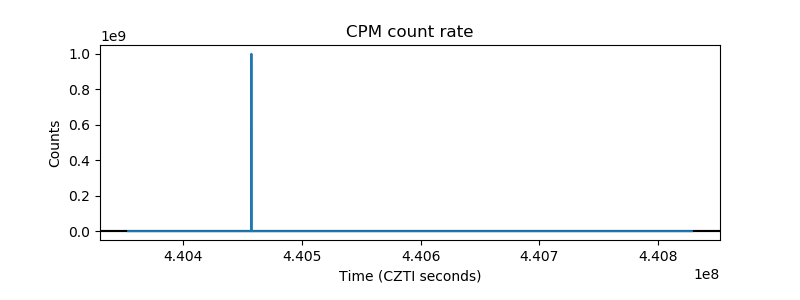 |
| CZT Counter |  |
| +2.5 Volts monitor |  |
| +5 Volts monitor |  |
| _ROLL_ROT | 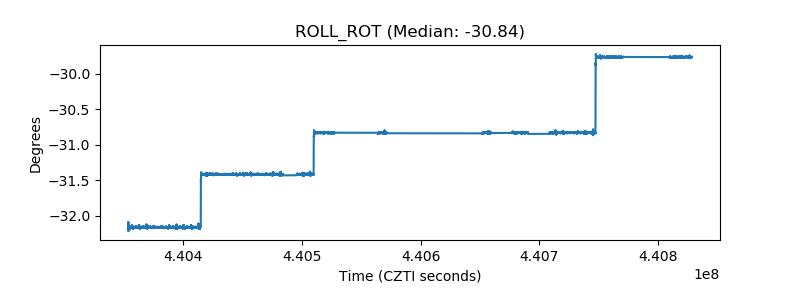 |
| _Roll_DEC |  |
| _Roll_RA | 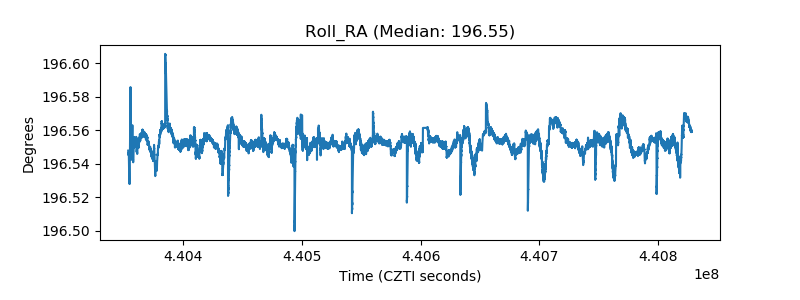 |
| Veto Counter | 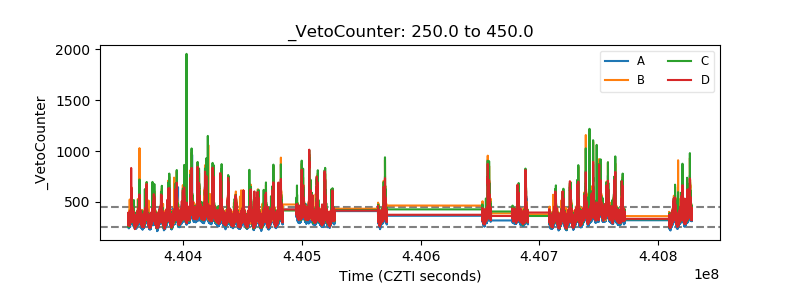 |