| Param | Original file | Final file |
|---|---|---|
| Filename | modeM0/AS1A13_008T06_9000005994cztM0_level2.fits | modeM0/AS1A13_008T06_9000005994cztM0_level2_quad_clean.evt |
| Size (bytes) | 1,077,143,040 | 1,087,214,400 |
| Size | 1.0 GB | 1.0 GB |
| Events in quadrant A | 6,126,602 | 5,887,161 |
| Events in quadrant B | 6,288,214 | 6,650,224 |
| Events in quadrant C | 6,451,868 | 6,449,965 |
| Events in quadrant D | 5,342,558 | 5,540,814 |
| Mode M9 | |||
|---|---|---|---|
| Quadrant | BADHDUFLAG | Total packets | Discarded packets |
| A | 0 | 131 | 0 |
| B | 0 | 131 | 0 |
| C | 0 | 131 | 0 |
| D | 0 | 131 | 0 |
| Mode SS | |||
|---|---|---|---|
| Quadrant | BADHDUFLAG | Total packets | Discarded packets |
| A | 0 | 2490 | 0 |
| B | 0 | 2490 | 0 |
| C | 0 | 2490 | 0 |
| D | 0 | 2490 | 0 |
| Mode M0 | |||
|---|---|---|---|
| Quadrant | BADHDUFLAG | Total packets | Discarded packets |
| A | 0 | 482773 | 0 |
| B | 0 | 278449 | 0 |
| C | 0 | 274834 | 0 |
| D | 0 | 380165 | 0 |
| Quadrant | Total seconds | Saturated seconds | Saturation percentage |
|---|---|---|---|
| A | 122543 | 17213 | 14.046498% |
| B | 122548 | 3295 | 2.688742% |
| C | 122550 | 2216 | 1.808242% |
| D | 122541 | 11563 | 9.436025% |
Noise dominated data is calculated using 1-second bins in cleaned event files. If a bin has >2000 counts, and if more than 50% of those come from <1% of pixels, then it is considered to be noise-dominated and hence unusable.
| Quadrant | # 1 sec bins | Bins with >0 counts | Bins with >2000 counts | High rate bins dominated by noise | Noise dominated (total time) | Noise dominated (detector-on time) | Marked lightcurve |
|---|---|---|---|---|---|---|---|
| A | 145146 | 122437 | 0 | 0 | 0.00% | 0.00% |  |
| B | 145146 | 122503 | 0 | 0 | 0.00% | 0.00% |  |
| C | 145146 | 122527 | 0 | 0 | 0.00% | 0.00% |  |
| D | 145146 | 122178 | 0 | 0 | 0.00% | 0.00% |  |
Top three noisy pixels from each quadrant. If the there are fewer than three noisy pixels in the level2.evt file, extra rows are filled as -1
| Pixel properties | Quadrant properties | ||||||
|---|---|---|---|---|---|---|---|
| Quadrant | DetID | PixID | Counts | Sigma | Mean | Median | Sigma |
| A | 7 | 110 | 5054 | 8.75 | 1596 | 1484 | 408.0 |
| A | 15 | 236 | 4867 | 8.29 | 1596 | 1484 | 408.0 |
| A | 0 | 29 | 4787 | 8.1 | 1596 | 1484 | 408.0 |
| B | 2 | 9 | 5635 | 12.34 | 1664 | 1579 | 328.8 |
| B | 3 | 17 | 4560 | 9.07 | 1664 | 1579 | 328.8 |
| B | 2 | 8 | 4411 | 8.61 | 1664 | 1579 | 328.8 |
| C | 3 | 202 | 5057 | 7.93 | 1708 | 1582 | 438.3 |
| C | 3 | 203 | 4821 | 7.39 | 1708 | 1582 | 438.3 |
| C | 1 | 81 | 4760 | 7.25 | 1708 | 1582 | 438.3 |
| D | 10 | 189 | 4060 | 6.2 | 1537 | 1395 | 430.1 |
| D | 3 | 14 | 4009 | 6.08 | 1537 | 1395 | 430.1 |
| D | 4 | 16 | 3930 | 5.89 | 1537 | 1395 | 430.1 |
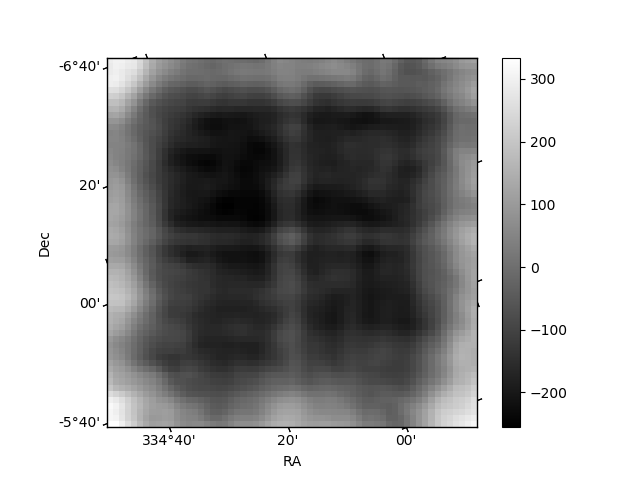
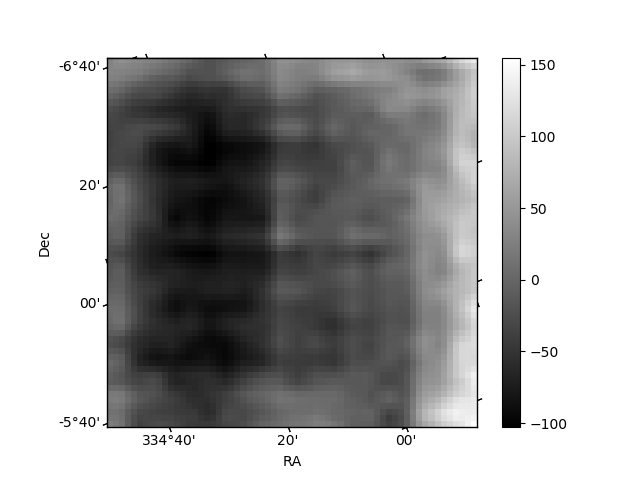
Histogram calculated using DETX and DETY for each event in the final _common_clean file
| Quadrant A |  |
 |
Quadrant B |
|---|---|---|---|
| Quadrant D |  |
 |
Quadrant C |
| Plot type | Count rate plots | Images |
|---|---|---|
| Comparison with Poisson distribution Blue bars denote a histogram of data divided into 1 sec bins. Red curve is a Poisson curve with rate = median count rate of data. |
 |
 |
| Quadrant-wise count rates Data is divided into 100 sec bins |
 |
|
| Module-wise count rates for Quadrant A Data is divided into 100 sec bins |
 |
 |
| Module-wise count rates for Quadrant B Data is divided into 100 sec bins |
 |
 |
| Module-wise count rates for Quadrant C Data is divided into 100 sec bins |
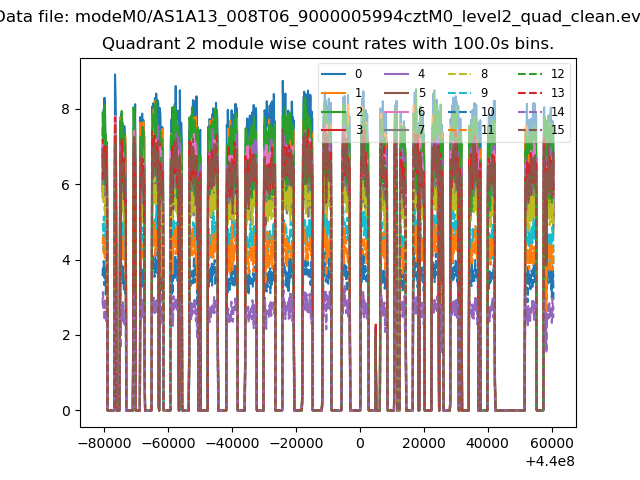 |
 |
| Module-wise count rates for Quadrant D Data is divided into 100 sec bins |
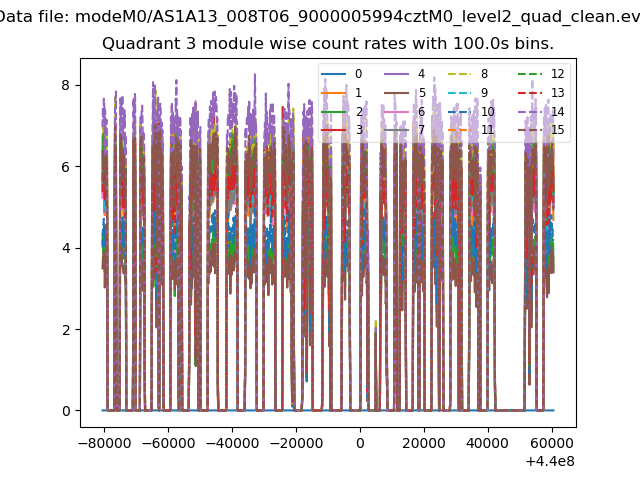 |
 |
| Parameter | Plot |
|---|---|
| CZT HV Monitor |  |
| D_VDD |  |
| Temperature 1 |  |
| Veto HV Monitor |  |
| Veto LLD |  |
| Alpha Counter |  |
| _CPM_Rate |  |
| CZT Counter |  |
| +2.5 Volts monitor |  |
| +5 Volts monitor |  |
| _ROLL_ROT |  |
| _Roll_DEC |  |
| _Roll_RA |  |
| Veto Counter |  |