| Param | Original file | Final file |
|---|---|---|
| Filename | modeM0/AS1A13_004T13_9000005988cztM0_level2.fits | modeM0/AS1A13_004T13_9000005988cztM0_level2_quad_clean.evt |
| Size (bytes) | 766,215,360 | 807,209,280 |
| Size | 730.7 MB | 769.8 MB |
| Events in quadrant A | 4,603,152 | 4,967,517 |
| Events in quadrant B | 4,380,948 | 4,836,913 |
| Events in quadrant C | 4,586,114 | 4,739,643 |
| Events in quadrant D | 3,786,638 | 4,060,066 |
| Mode M0 | |||
|---|---|---|---|
| Quadrant | BADHDUFLAG | Total packets | Discarded packets |
| A | 0 | 251723 | 0 |
| B | 0 | 204719 | 0 |
| C | 0 | 182269 | 0 |
| D | 0 | 262835 | 0 |
| Mode SS | |||
|---|---|---|---|
| Quadrant | BADHDUFLAG | Total packets | Discarded packets |
| A | 0 | 1734 | 0 |
| B | 0 | 1734 | 0 |
| C | 0 | 1734 | 0 |
| D | 0 | 1734 | 0 |
| Mode M9 | |||
|---|---|---|---|
| Quadrant | BADHDUFLAG | Total packets | Discarded packets |
| A | 0 | 121 | 0 |
| B | 0 | 122 | 0 |
| C | 0 | 122 | 0 |
| D | 0 | 122 | 0 |
| Quadrant | Total seconds | Saturated seconds | Saturation percentage |
|---|---|---|---|
| A | 85220 | 2182 | 2.560432% |
| B | 85219 | 3493 | 4.098851% |
| C | 85217 | 988 | 1.159393% |
| D | 85220 | 7847 | 9.207932% |
Noise dominated data is calculated using 1-second bins in cleaned event files. If a bin has >2000 counts, and if more than 50% of those come from <1% of pixels, then it is considered to be noise-dominated and hence unusable.
| Quadrant | # 1 sec bins | Bins with >0 counts | Bins with >2000 counts | High rate bins dominated by noise | Noise dominated (total time) | Noise dominated (detector-on time) | Marked lightcurve |
|---|---|---|---|---|---|---|---|
| A | 96524 | 85214 | 0 | 0 | 0.00% | 0.00% | 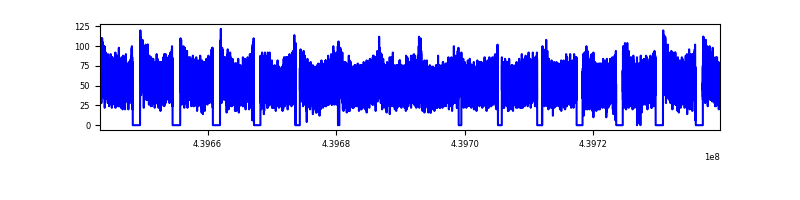 |
| B | 96524 | 85166 | 0 | 0 | 0.00% | 0.00% |  |
| C | 96524 | 85191 | 0 | 0 | 0.00% | 0.00% |  |
| D | 96524 | 85002 | 0 | 0 | 0.00% | 0.00% | 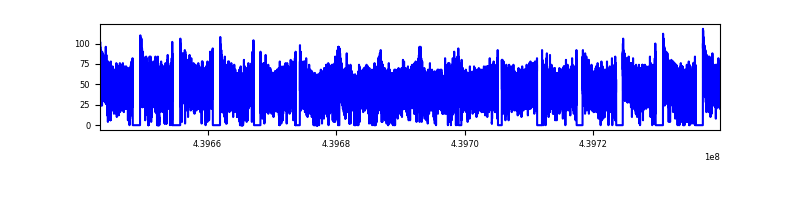 |
Top three noisy pixels from each quadrant. If the there are fewer than three noisy pixels in the level2.evt file, extra rows are filled as -1
| Pixel properties | Quadrant properties | ||||||
|---|---|---|---|---|---|---|---|
| Quadrant | DetID | PixID | Counts | Sigma | Mean | Median | Sigma |
| A | 7 | 110 | 3809 | 8.84 | 1200 | 1121 | 303.9 |
| A | 0 | 29 | 3608 | 8.18 | 1200 | 1121 | 303.9 |
| A | 7 | 109 | 3541 | 7.96 | 1200 | 1121 | 303.9 |
| B | 2 | 9 | 3998 | 12.72 | 1158 | 1103 | 227.6 |
| B | 2 | 8 | 3201 | 9.22 | 1158 | 1103 | 227.6 |
| B | 3 | 17 | 3178 | 9.12 | 1158 | 1103 | 227.6 |
| C | 3 | 202 | 3548 | 7.73 | 1214 | 1129 | 313.1 |
| C | 3 | 203 | 3463 | 7.45 | 1214 | 1129 | 313.1 |
| C | 1 | 81 | 3421 | 7.32 | 1214 | 1129 | 313.1 |
| D | 10 | 189 | 2838 | 6.12 | 1091 | 990 | 301.9 |
| D | 6 | 67 | 2750 | 5.83 | 1091 | 990 | 301.9 |
| D | 4 | 16 | 2739 | 5.79 | 1091 | 990 | 301.9 |
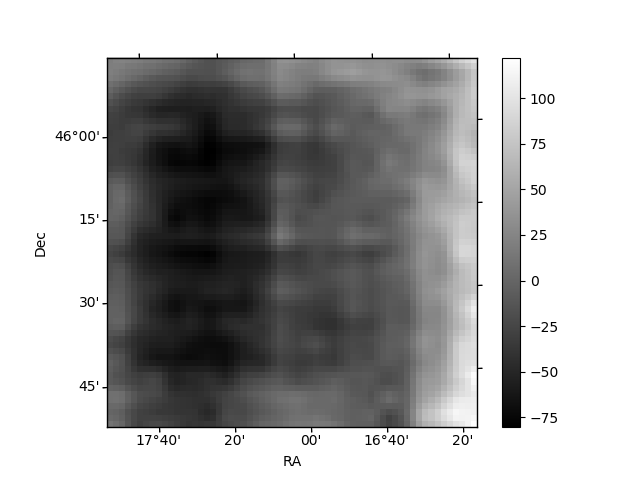
Histogram calculated using DETX and DETY for each event in the final _common_clean file
| Quadrant A | 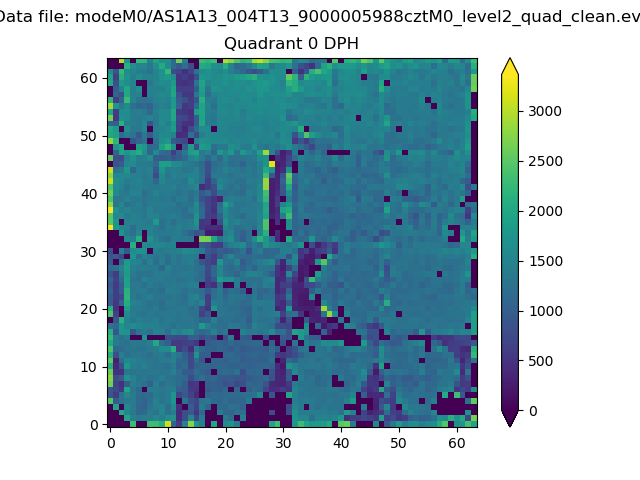 |
 |
Quadrant B |
|---|---|---|---|
| Quadrant D |  |
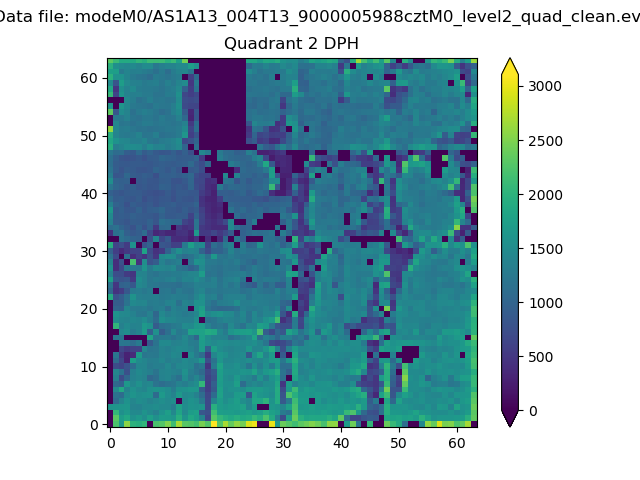 |
Quadrant C |
| Plot type | Count rate plots | Images |
|---|---|---|
| Comparison with Poisson distribution Blue bars denote a histogram of data divided into 1 sec bins. Red curve is a Poisson curve with rate = median count rate of data. |
 |
 |
| Quadrant-wise count rates Data is divided into 100 sec bins |
 |
|
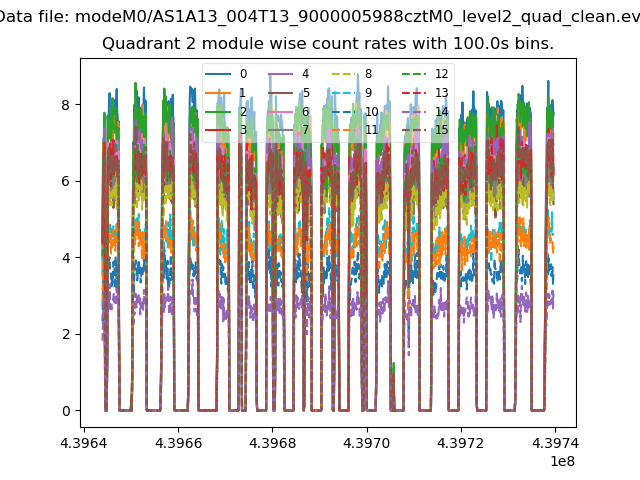
| Module-wise count rates for Quadrant A Data is divided into 100 sec bins |
 |
 |
| Module-wise count rates for Quadrant B Data is divided into 100 sec bins |
 |
 |
| Module-wise count rates for Quadrant C Data is divided into 100 sec bins |
 |
 |
| Module-wise count rates for Quadrant D Data is divided into 100 sec bins |
 |
 |
| Parameter | Plot |
|---|---|
| CZT HV Monitor | 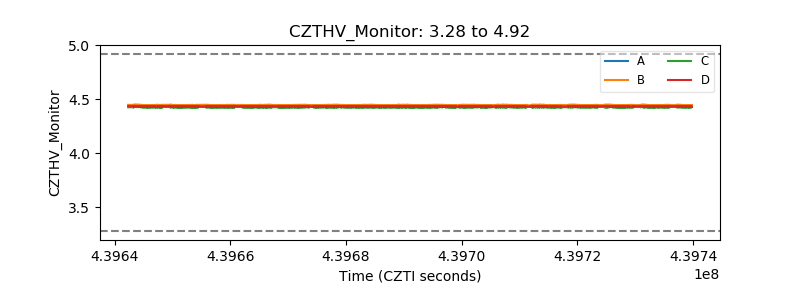 |
| D_VDD |  |
| Temperature 1 | 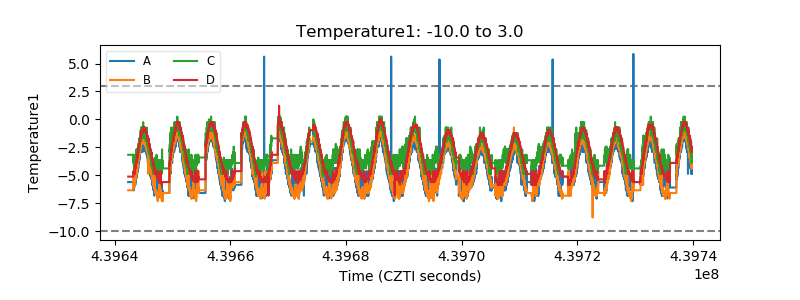 |
| Veto HV Monitor |  |
| Veto LLD |  |
| Alpha Counter | 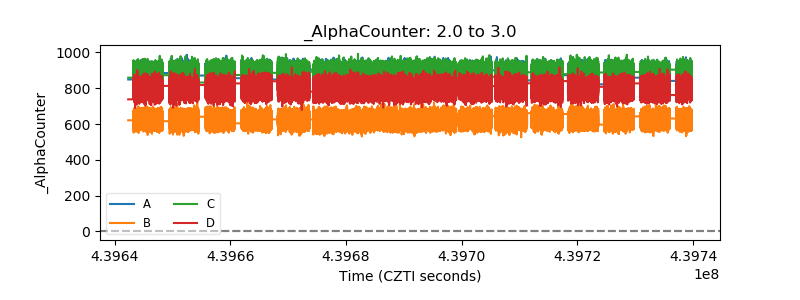 |
| _CPM_Rate |  |
| CZT Counter |  |
| +2.5 Volts monitor |  |
| +5 Volts monitor |  |
| _ROLL_ROT |  |
| _Roll_DEC | 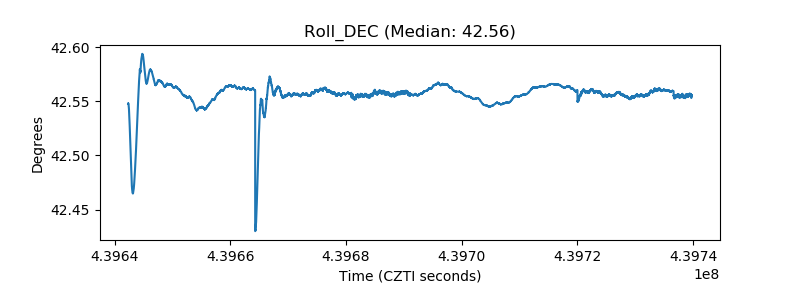 |
| _Roll_RA |  |
| Veto Counter |  |