| Param | Original file | Final file |
|---|---|---|
| Filename | modeM0/AS1A13_080T06_9000005982cztM0_level2.fits | modeM0/AS1A13_080T06_9000005982cztM0_level2_quad_clean.evt |
| Size (bytes) | 306,095,040 | 425,727,360 |
| Size | 291.9 MB | 406.0 MB |
| Events in quadrant A | 1,574,350 | 2,255,828 |
| Events in quadrant B | 1,794,690 | 2,915,727 |
| Events in quadrant C | 1,872,472 | 2,833,454 |
| Events in quadrant D | 1,531,866 | 2,398,828 |
| Mode M0 | |||
|---|---|---|---|
| Quadrant | BADHDUFLAG | Total packets | Discarded packets |
| A | 0 | 177826 | 0 |
| B | 0 | 88774 | 0 |
| C | 0 | 77520 | 0 |
| D | 0 | 116863 | 0 |
| Mode M9 | |||
|---|---|---|---|
| Quadrant | BADHDUFLAG | Total packets | Discarded packets |
| A | 0 | 52 | 0 |
| B | 0 | 52 | 0 |
| C | 0 | 52 | 0 |
| D | 0 | 52 | 0 |
| Mode SS | |||
|---|---|---|---|
| Quadrant | BADHDUFLAG | Total packets | Discarded packets |
| A | 0 | 740 | 0 |
| B | 0 | 740 | 0 |
| C | 0 | 740 | 0 |
| D | 0 | 740 | 0 |
| Quadrant | Total seconds | Saturated seconds | Saturation percentage |
|---|---|---|---|
| A | 36233 | 10570 | 29.172301% |
| B | 36233 | 1277 | 3.524411% |
| C | 36233 | 617 | 1.702868% |
| D | 36233 | 3258 | 8.991803% |
Noise dominated data is calculated using 1-second bins in cleaned event files. If a bin has >2000 counts, and if more than 50% of those come from <1% of pixels, then it is considered to be noise-dominated and hence unusable.
| Quadrant | # 1 sec bins | Bins with >0 counts | Bins with >2000 counts | High rate bins dominated by noise | Noise dominated (total time) | Noise dominated (detector-on time) | Marked lightcurve |
|---|---|---|---|---|---|---|---|
| A | 41594 | 35977 | 0 | 0 | 0.00% | 0.00% |  |
| B | 41594 | 36232 | 0 | 0 | 0.00% | 0.00% |  |
| C | 41594 | 36231 | 0 | 0 | 0.00% | 0.00% |  |
| D | 41594 | 36081 | 0 | 0 | 0.00% | 0.00% |  |
Top three noisy pixels from each quadrant. If the there are fewer than three noisy pixels in the level2.evt file, extra rows are filled as -1
| Pixel properties | Quadrant properties | ||||||
|---|---|---|---|---|---|---|---|
| Quadrant | DetID | PixID | Counts | Sigma | Mean | Median | Sigma |
| A | 7 | 110 | 1344 | 9.0 | 411 | 385 | 106.5 |
| A | 0 | 29 | 1241 | 8.04 | 411 | 385 | 106.5 |
| A | 7 | 109 | 1237 | 8.0 | 411 | 385 | 106.5 |
| B | 2 | 9 | 1547 | 11.36 | 478 | 457 | 95.9 |
| B | 3 | 17 | 1270 | 8.48 | 478 | 457 | 95.9 |
| B | 14 | 254 | 1219 | 7.94 | 478 | 457 | 95.9 |
| C | 3 | 202 | 1507 | 8.15 | 495 | 462 | 128.3 |
| C | 1 | 81 | 1494 | 8.05 | 495 | 462 | 128.3 |
| C | 1 | 80 | 1452 | 7.72 | 495 | 462 | 128.3 |
| D | 10 | 189 | 1225 | 6.73 | 441 | 400 | 122.5 |
| D | 6 | 67 | 1133 | 5.98 | 441 | 400 | 122.5 |
| D | 10 | 113 | 1120 | 5.88 | 441 | 400 | 122.5 |
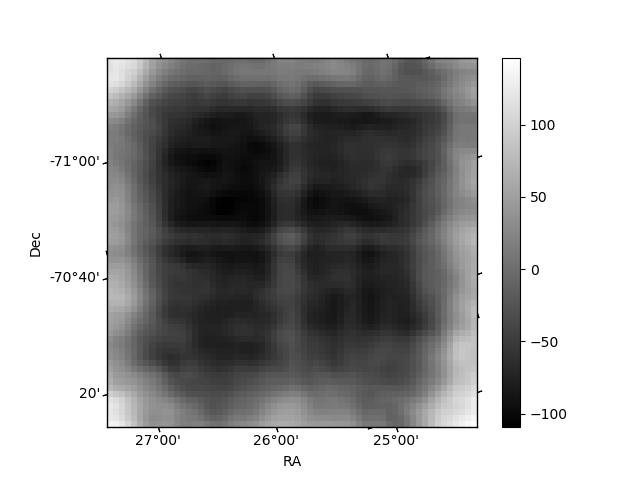
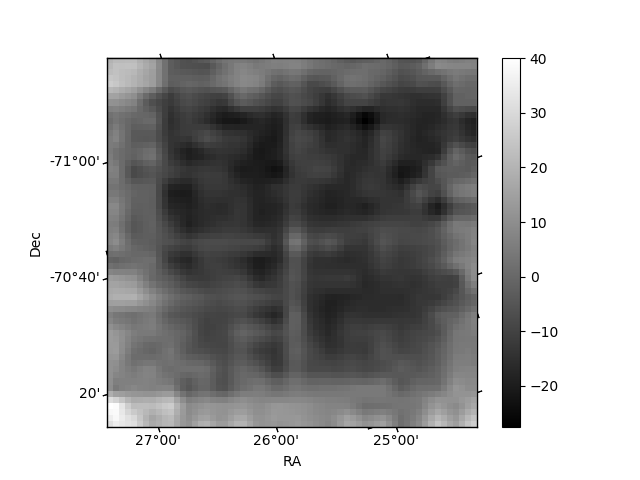
Histogram calculated using DETX and DETY for each event in the final _common_clean file
| Quadrant A |  |
 |
Quadrant B |
|---|---|---|---|
| Quadrant D |  |
 |
Quadrant C |
| Plot type | Count rate plots | Images |
|---|---|---|
| Comparison with Poisson distribution Blue bars denote a histogram of data divided into 1 sec bins. Red curve is a Poisson curve with rate = median count rate of data. |
 |
 |
| Quadrant-wise count rates Data is divided into 100 sec bins |
 |
|
| Module-wise count rates for Quadrant A Data is divided into 100 sec bins |
 |
 |
| Module-wise count rates for Quadrant B Data is divided into 100 sec bins |
 |
 |
| Module-wise count rates for Quadrant C Data is divided into 100 sec bins |
 |
 |
| Module-wise count rates for Quadrant D Data is divided into 100 sec bins |
 |
 |
| Parameter | Plot |
|---|---|
| CZT HV Monitor | 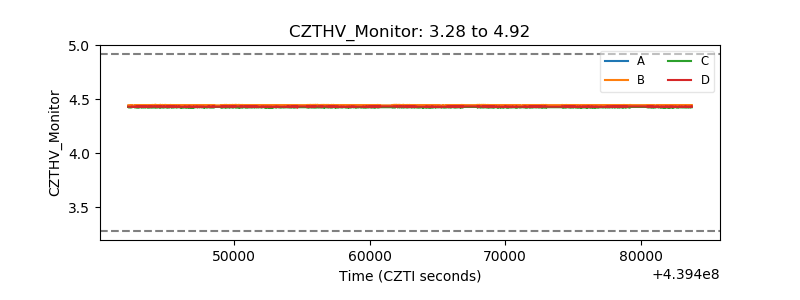 |
| D_VDD |  |
| Temperature 1 |  |
| Veto HV Monitor |  |
| Veto LLD |  |
| Alpha Counter |  |
| _CPM_Rate |  |
| CZT Counter |  |
| +2.5 Volts monitor |  |
| +5 Volts monitor |  |
| _ROLL_ROT |  |
| _Roll_DEC |  |
| _Roll_RA |  |
| Veto Counter |  |