| Param | Original file | Final file |
|---|---|---|
| Filename | modeM0/AS1A13_077T01_9000005984cztM0_level2.fits | modeM0/AS1A13_077T01_9000005984cztM0_level2_quad_clean.evt |
| Size (bytes) | 720,717,120 | 685,857,600 |
| Size | 687.3 MB | 654.1 MB |
| Events in quadrant A | 4,202,410 | 3,939,444 |
| Events in quadrant B | 4,207,330 | 4,060,800 |
| Events in quadrant C | 4,352,998 | 3,868,875 |
| Events in quadrant D | 3,606,362 | 3,450,040 |
| Mode M0 | |||
|---|---|---|---|
| Quadrant | BADHDUFLAG | Total packets | Discarded packets |
| A | 0 | 273614 | 0 |
| B | 0 | 179954 | 0 |
| C | 0 | 182754 | 0 |
| D | 0 | 239522 | 0 |
| Mode M9 | |||
|---|---|---|---|
| Quadrant | BADHDUFLAG | Total packets | Discarded packets |
| A | 0 | 113 | 0 |
| B | 0 | 113 | 0 |
| C | 0 | 113 | 0 |
| D | 0 | 113 | 0 |
| Mode SS | |||
|---|---|---|---|
| Quadrant | BADHDUFLAG | Total packets | Discarded packets |
| A | 0 | 1614 | 0 |
| B | 0 | 1614 | 0 |
| C | 0 | 1614 | 0 |
| D | 0 | 1614 | 0 |
| Quadrant | Total seconds | Saturated seconds | Saturation percentage |
|---|---|---|---|
| A | 79516 | 7076 | 8.898838% |
| B | 79516 | 1743 | 2.192012% |
| C | 79516 | 1284 | 1.614769% |
| D | 79515 | 5800 | 7.294221% |
Noise dominated data is calculated using 1-second bins in cleaned event files. If a bin has >2000 counts, and if more than 50% of those come from <1% of pixels, then it is considered to be noise-dominated and hence unusable.
| Quadrant | # 1 sec bins | Bins with >0 counts | Bins with >2000 counts | High rate bins dominated by noise | Noise dominated (total time) | Noise dominated (detector-on time) | Marked lightcurve |
|---|---|---|---|---|---|---|---|
| A | 90751 | 79465 | 0 | 0 | 0.00% | 0.00% |  |
| B | 90751 | 79512 | 0 | 0 | 0.00% | 0.00% |  |
| C | 90751 | 79504 | 0 | 0 | 0.00% | 0.00% |  |
| D | 90750 | 79445 | 0 | 0 | 0.00% | 0.00% |  |
Top three noisy pixels from each quadrant. If the there are fewer than three noisy pixels in the level2.evt file, extra rows are filled as -1
| Pixel properties | Quadrant properties | ||||||
|---|---|---|---|---|---|---|---|
| Quadrant | DetID | PixID | Counts | Sigma | Mean | Median | Sigma |
| A | 7 | 110 | 3408 | 8.66 | 1094 | 1021 | 275.6 |
| A | 15 | 236 | 3330 | 8.38 | 1094 | 1021 | 275.6 |
| A | 0 | 29 | 3295 | 8.25 | 1094 | 1021 | 275.6 |
| B | 2 | 9 | 3811 | 12.51 | 1112 | 1056 | 220.3 |
| B | 2 | 8 | 3056 | 9.08 | 1112 | 1056 | 220.3 |
| B | 3 | 17 | 3020 | 8.92 | 1112 | 1056 | 220.3 |
| C | 3 | 202 | 3279 | 7.42 | 1151 | 1065 | 298.5 |
| C | 3 | 203 | 3249 | 7.32 | 1151 | 1065 | 298.5 |
| C | 1 | 81 | 3215 | 7.2 | 1151 | 1065 | 298.5 |
| D | 7 | 3 | 2638 | 5.9 | 1040 | 948 | 286.3 |
| D | 10 | 189 | 2624 | 5.85 | 1040 | 948 | 286.3 |
| D | 6 | 67 | 2576 | 5.69 | 1040 | 948 | 286.3 |
Histogram calculated using DETX and DETY for each event in the final _common_clean file
| Quadrant A |  |
 |
Quadrant B |
|---|---|---|---|
| Quadrant D | 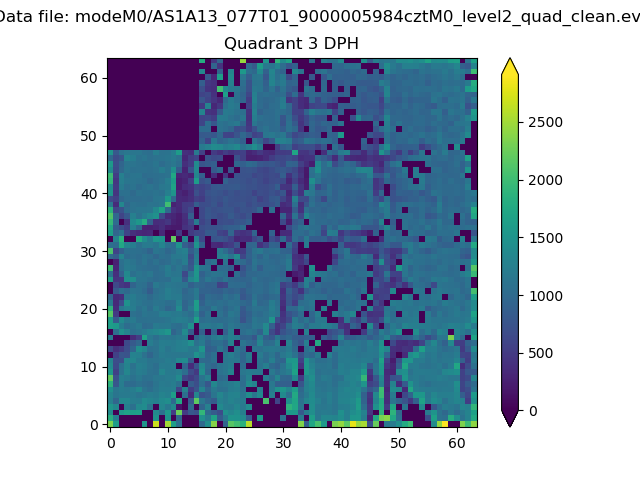 |
 |
Quadrant C |
| Plot type | Count rate plots | Images |
|---|---|---|
| Comparison with Poisson distribution Blue bars denote a histogram of data divided into 1 sec bins. Red curve is a Poisson curve with rate = median count rate of data. |
 |
 |
| Quadrant-wise count rates Data is divided into 100 sec bins |
 |
|
| Module-wise count rates for Quadrant A Data is divided into 100 sec bins |
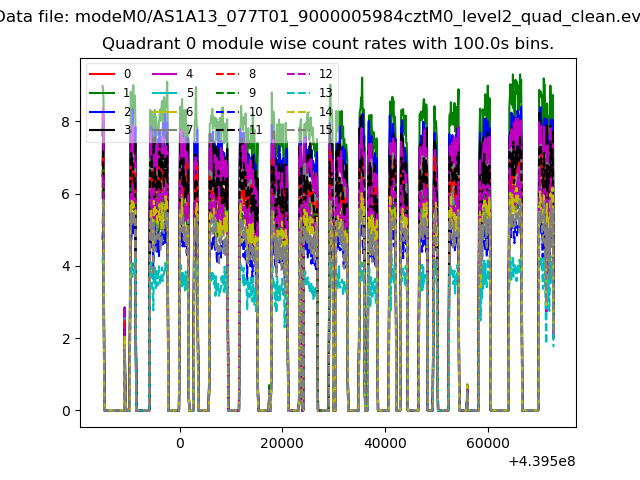 |
 |
| Module-wise count rates for Quadrant B Data is divided into 100 sec bins |
 |
 |
| Module-wise count rates for Quadrant C Data is divided into 100 sec bins |
 |
 |
| Module-wise count rates for Quadrant D Data is divided into 100 sec bins |
 |
 |
| Parameter | Plot |
|---|---|
| CZT HV Monitor |  |
| D_VDD |  |
| Temperature 1 |  |
| Veto HV Monitor |  |
| Veto LLD | 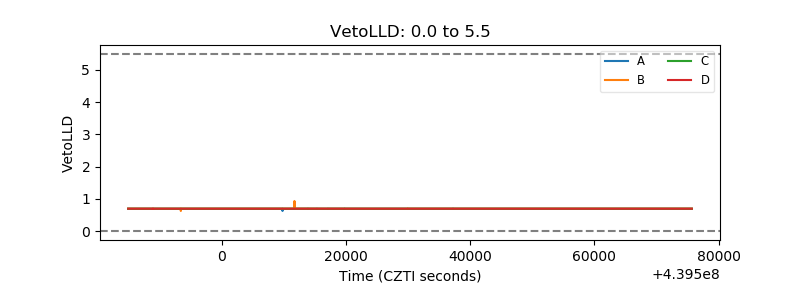 |
| Alpha Counter |  |
| _CPM_Rate |  |
| CZT Counter |  |
| +2.5 Volts monitor | 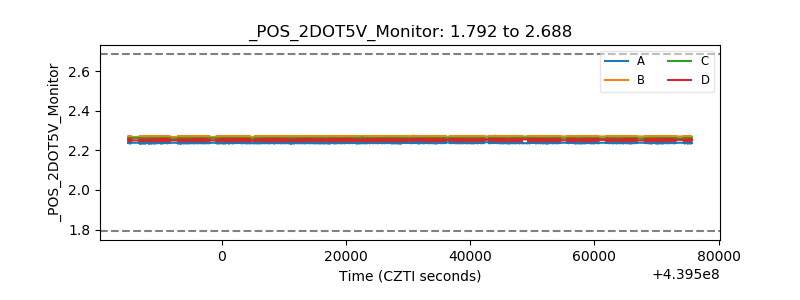 |
| +5 Volts monitor | 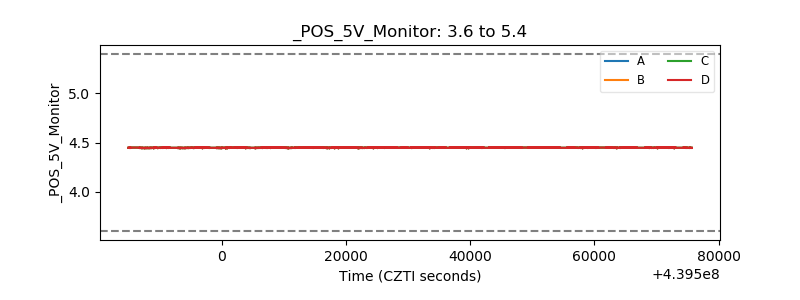 |
| _ROLL_ROT | 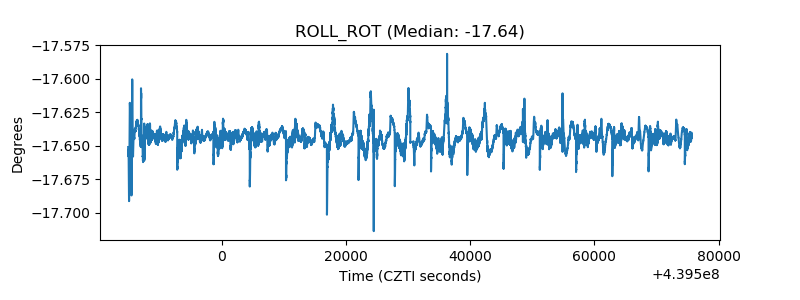 |
| _Roll_DEC |  |
| _Roll_RA |  |
| Veto Counter |  |