| Param | Original file | Final file |
|---|---|---|
| Filename | modeM0/AS1A13_080T05_9000005980cztM0_level2.fits | modeM0/AS1A13_080T05_9000005980cztM0_level2_quad_clean.evt |
| Size (bytes) | 362,574,720 | 526,481,280 |
| Size | 345.8 MB | 502.1 MB |
| Events in quadrant A | 2,076,572 | 3,261,903 |
| Events in quadrant B | 2,079,842 | 3,518,169 |
| Events in quadrant C | 2,152,096 | 3,346,114 |
| Events in quadrant D | 1,802,462 | 2,953,155 |
| Mode SS | |||
|---|---|---|---|
| Quadrant | BADHDUFLAG | Total packets | Discarded packets |
| A | 0 | 842 | 0 |
| B | 0 | 842 | 0 |
| C | 0 | 842 | 0 |
| D | 0 | 842 | 0 |
| Mode M9 | |||
|---|---|---|---|
| Quadrant | BADHDUFLAG | Total packets | Discarded packets |
| A | 0 | 50 | 0 |
| B | 0 | 50 | 0 |
| C | 0 | 50 | 0 |
| D | 0 | 50 | 0 |
| Mode M0 | |||
|---|---|---|---|
| Quadrant | BADHDUFLAG | Total packets | Discarded packets |
| A | 0 | 154587 | 0 |
| B | 0 | 106966 | 0 |
| C | 0 | 89324 | 0 |
| D | 0 | 113935 | 0 |
| Quadrant | Total seconds | Saturated seconds | Saturation percentage |
|---|---|---|---|
| A | 41764 | 3767 | 9.019730% |
| B | 41765 | 1245 | 2.980965% |
| C | 41765 | 281 | 0.672812% |
| D | 41765 | 1777 | 4.254759% |
Noise dominated data is calculated using 1-second bins in cleaned event files. If a bin has >2000 counts, and if more than 50% of those come from <1% of pixels, then it is considered to be noise-dominated and hence unusable.
| Quadrant | # 1 sec bins | Bins with >0 counts | Bins with >2000 counts | High rate bins dominated by noise | Noise dominated (total time) | Noise dominated (detector-on time) | Marked lightcurve |
|---|---|---|---|---|---|---|---|
| A | 51832 | 41726 | 0 | 0 | 0.00% | 0.00% | 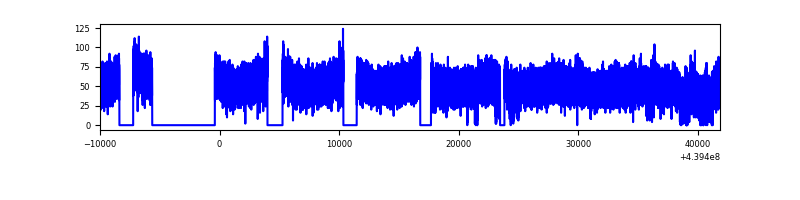 |
| B | 51832 | 41764 | 0 | 0 | 0.00% | 0.00% |  |
| C | 51832 | 41766 | 0 | 0 | 0.00% | 0.00% |  |
| D | 51832 | 41750 | 0 | 0 | 0.00% | 0.00% | 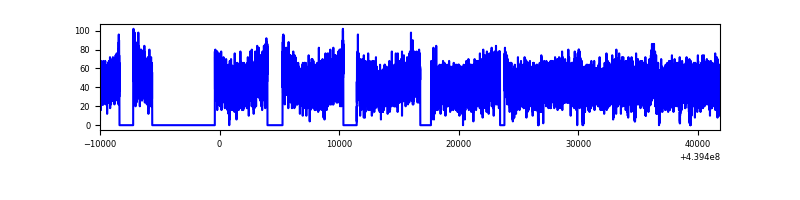 |
Top three noisy pixels from each quadrant. If the there are fewer than three noisy pixels in the level2.evt file, extra rows are filled as -1
| Pixel properties | Quadrant properties | ||||||
|---|---|---|---|---|---|---|---|
| Quadrant | DetID | PixID | Counts | Sigma | Mean | Median | Sigma |
| A | 7 | 110 | 1791 | 9.24 | 542 | 509 | 138.8 |
| A | 0 | 29 | 1679 | 8.43 | 542 | 509 | 138.8 |
| A | 7 | 109 | 1650 | 8.22 | 542 | 509 | 138.8 |
| B | 2 | 9 | 1873 | 12.21 | 553 | 528 | 110.1 |
| B | 3 | 17 | 1548 | 9.26 | 553 | 528 | 110.1 |
| B | 2 | 8 | 1499 | 8.82 | 553 | 528 | 110.1 |
| C | 3 | 202 | 1681 | 7.81 | 570 | 532 | 147.2 |
| C | 3 | 203 | 1626 | 7.43 | 570 | 532 | 147.2 |
| C | 1 | 80 | 1608 | 7.31 | 570 | 532 | 147.2 |
| D | 10 | 189 | 1396 | 6.38 | 519 | 471 | 145.1 |
| D | 6 | 79 | 1368 | 6.18 | 519 | 471 | 145.1 |
| D | 4 | 16 | 1334 | 5.95 | 519 | 471 | 145.1 |
Histogram calculated using DETX and DETY for each event in the final _common_clean file
| Quadrant A |  |
 |
Quadrant B |
|---|---|---|---|
| Quadrant D |  |
 |
Quadrant C |
| Plot type | Count rate plots | Images |
|---|---|---|
| Comparison with Poisson distribution Blue bars denote a histogram of data divided into 1 sec bins. Red curve is a Poisson curve with rate = median count rate of data. |
 |
 |
| Quadrant-wise count rates Data is divided into 100 sec bins |
 |
|
| Module-wise count rates for Quadrant A Data is divided into 100 sec bins |
 |
 |
| Module-wise count rates for Quadrant B Data is divided into 100 sec bins |
 |
 |
| Module-wise count rates for Quadrant C Data is divided into 100 sec bins |
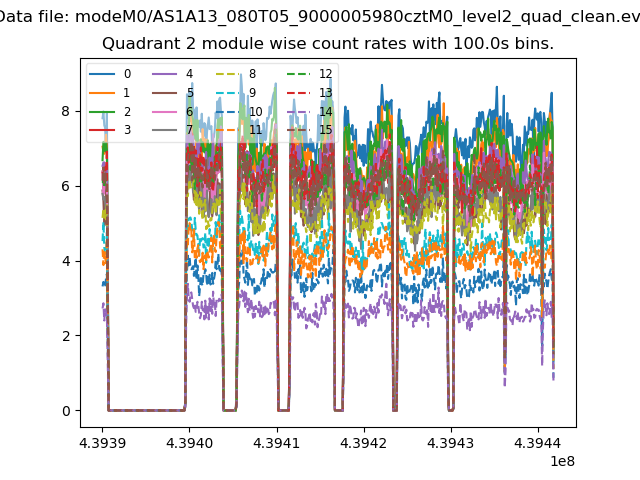 |
 |
| Module-wise count rates for Quadrant D Data is divided into 100 sec bins |
 |
 |
| Parameter | Plot |
|---|---|
| CZT HV Monitor | 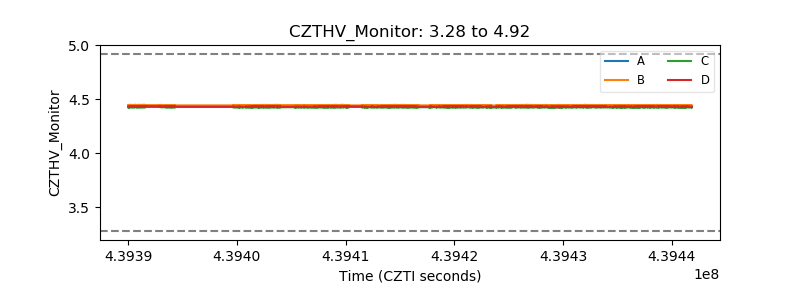 |
| D_VDD | 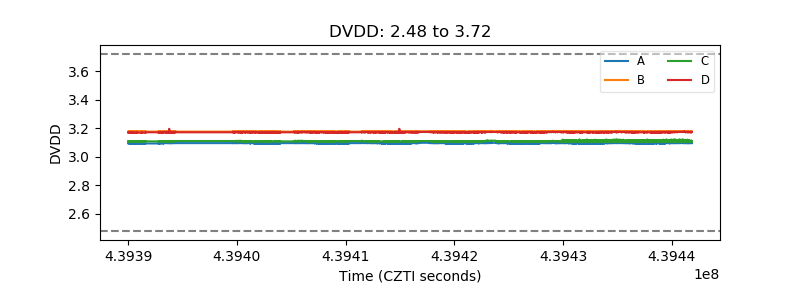 |
| Temperature 1 | 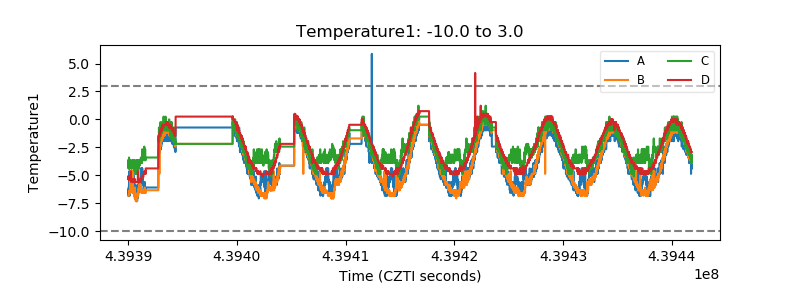 |
| Veto HV Monitor |  |
| Veto LLD |  |
| Alpha Counter |  |
| _CPM_Rate |  |
| CZT Counter | 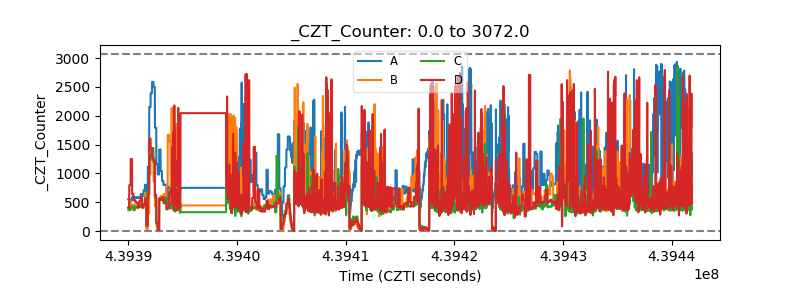 |
| +2.5 Volts monitor |  |
| +5 Volts monitor |  |
| _ROLL_ROT |  |
| _Roll_DEC |  |
| _Roll_RA |  |
| Veto Counter |  |