| Param | Original file | Final file |
|---|---|---|
| Filename | modeM0/AS1A13_047T01_9000005970cztM0_level2.fits | modeM0/AS1A13_047T01_9000005970cztM0_level2_quad_clean.evt |
| Size (bytes) | 336,070,080 | 294,379,200 |
| Size | 320.5 MB | 280.7 MB |
| Events in quadrant A | 1,885,440 | 1,550,676 |
| Events in quadrant B | 1,945,940 | 1,694,766 |
| Events in quadrant C | 2,045,914 | 1,641,126 |
| Events in quadrant D | 1,703,060 | 1,434,576 |
| Mode SS | |||
|---|---|---|---|
| Quadrant | BADHDUFLAG | Total packets | Discarded packets |
| A | 0 | 764 | 0 |
| B | 0 | 764 | 0 |
| C | 0 | 764 | 0 |
| D | 0 | 764 | 0 |
| Mode M9 | |||
|---|---|---|---|
| Quadrant | BADHDUFLAG | Total packets | Discarded packets |
| A | 0 | 77 | 0 |
| B | 0 | 77 | 0 |
| C | 0 | 77 | 0 |
| D | 0 | 77 | 0 |
| Mode M0 | |||
|---|---|---|---|
| Quadrant | BADHDUFLAG | Total packets | Discarded packets |
| A | 0 | 184686 | 0 |
| B | 0 | 93808 | 0 |
| C | 0 | 82164 | 0 |
| D | 0 | 108777 | 0 |
| Quadrant | Total seconds | Saturated seconds | Saturation percentage |
|---|---|---|---|
| A | 37768 | 7113 | 18.833404% |
| B | 37768 | 2086 | 5.523194% |
| C | 37768 | 421 | 1.114700% |
| D | 37768 | 2024 | 5.359034% |
Noise dominated data is calculated using 1-second bins in cleaned event files. If a bin has >2000 counts, and if more than 50% of those come from <1% of pixels, then it is considered to be noise-dominated and hence unusable.
| Quadrant | # 1 sec bins | Bins with >0 counts | Bins with >2000 counts | High rate bins dominated by noise | Noise dominated (total time) | Noise dominated (detector-on time) | Marked lightcurve |
|---|---|---|---|---|---|---|---|
| A | 45193 | 37754 | 0 | 0 | 0.00% | 0.00% | 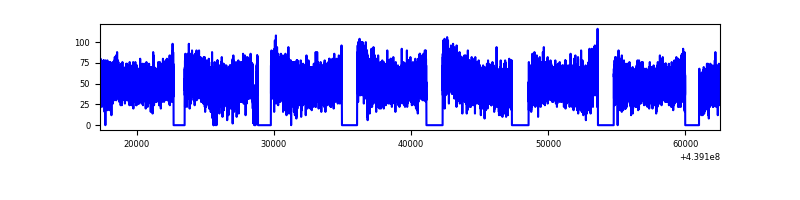 |
| B | 45193 | 37722 | 0 | 0 | 0.00% | 0.00% |  |
| C | 45193 | 37768 | 0 | 0 | 0.00% | 0.00% |  |
| D | 45193 | 37733 | 0 | 0 | 0.00% | 0.00% |  |
Top three noisy pixels from each quadrant. If the there are fewer than three noisy pixels in the level2.evt file, extra rows are filled as -1
| Pixel properties | Quadrant properties | ||||||
|---|---|---|---|---|---|---|---|
| Quadrant | DetID | PixID | Counts | Sigma | Mean | Median | Sigma |
| A | 7 | 110 | 1592 | 8.95 | 491 | 460 | 126.4 |
| A | 15 | 236 | 1489 | 8.14 | 491 | 460 | 126.4 |
| A | 0 | 29 | 1481 | 8.07 | 491 | 460 | 126.4 |
| B | 2 | 9 | 1759 | 12.01 | 514 | 489 | 105.8 |
| B | 2 | 8 | 1430 | 8.9 | 514 | 489 | 105.8 |
| B | 3 | 17 | 1363 | 8.26 | 514 | 489 | 105.8 |
| C | 1 | 81 | 1540 | 7.29 | 539 | 500 | 142.7 |
| C | 3 | 202 | 1521 | 7.15 | 539 | 500 | 142.7 |
| C | 3 | 203 | 1495 | 6.97 | 539 | 500 | 142.7 |
| D | 10 | 189 | 1239 | 5.82 | 488 | 444 | 136.7 |
| D | 7 | 3 | 1230 | 5.75 | 488 | 444 | 136.7 |
| D | 1 | 31 | 1218 | 5.66 | 488 | 444 | 136.7 |
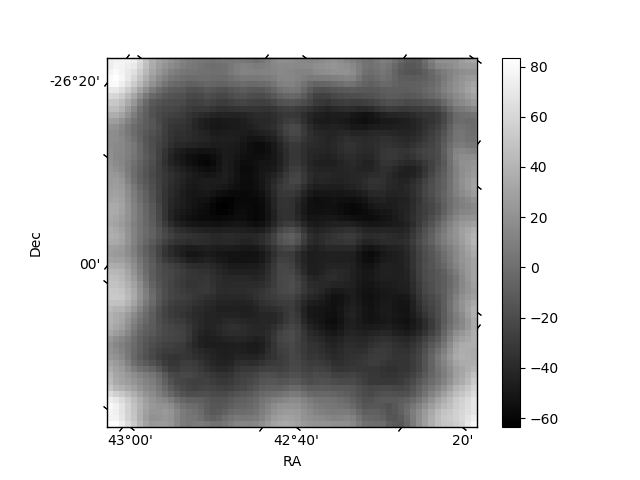
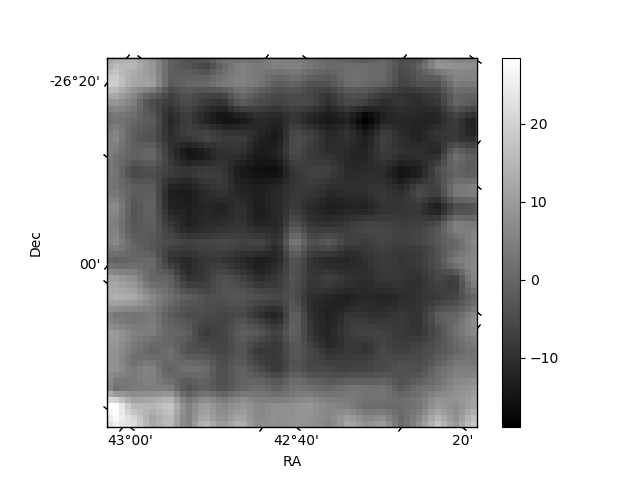
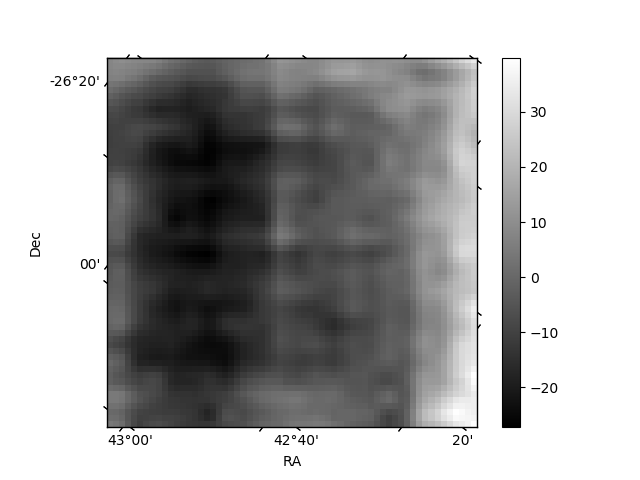
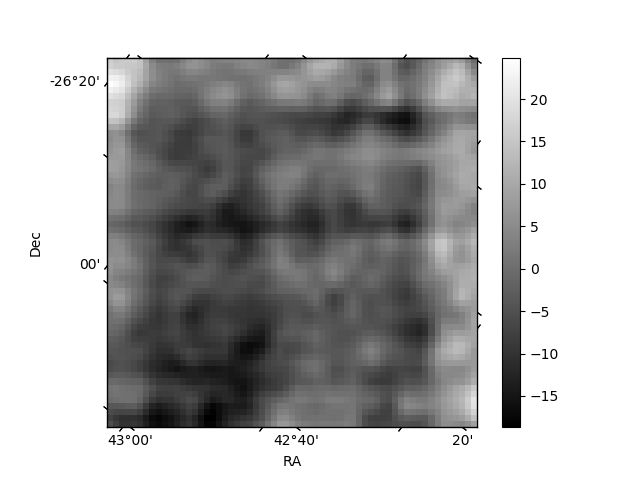
Histogram calculated using DETX and DETY for each event in the final _common_clean file
| Quadrant A |  |
 |
Quadrant B |
|---|---|---|---|
| Quadrant D |  |
 |
Quadrant C |
| Plot type | Count rate plots | Images |
|---|---|---|
| Comparison with Poisson distribution Blue bars denote a histogram of data divided into 1 sec bins. Red curve is a Poisson curve with rate = median count rate of data. |
 |
 |
| Quadrant-wise count rates Data is divided into 100 sec bins |
 |
|
| Module-wise count rates for Quadrant A Data is divided into 100 sec bins |
 |
 |
| Module-wise count rates for Quadrant B Data is divided into 100 sec bins |
 |
 |
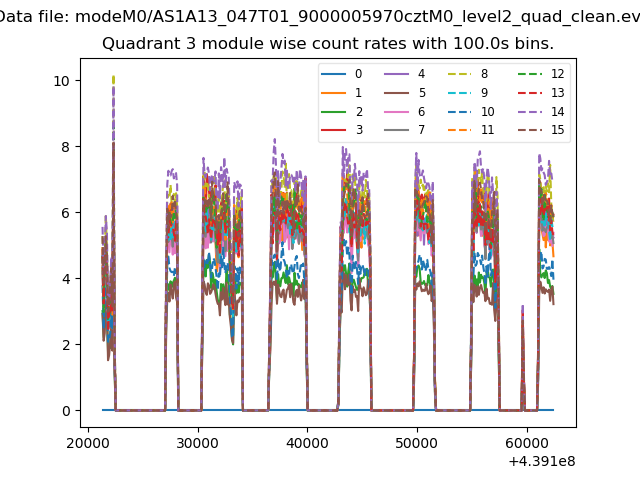
| Module-wise count rates for Quadrant C Data is divided into 100 sec bins |
 |
 |
| Module-wise count rates for Quadrant D Data is divided into 100 sec bins |
 |
 |
| Parameter | Plot |
|---|---|
| CZT HV Monitor |  |
| D_VDD |  |
| Temperature 1 |  |
| Veto HV Monitor |  |
| Veto LLD |  |
| Alpha Counter | 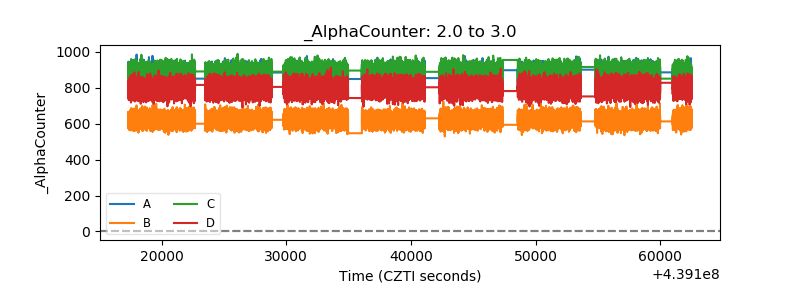 |
| _CPM_Rate |  |
| CZT Counter |  |
| +2.5 Volts monitor |  |
| +5 Volts monitor |  |
| _ROLL_ROT |  |
| _Roll_DEC |  |
| _Roll_RA |  |
| Veto Counter | 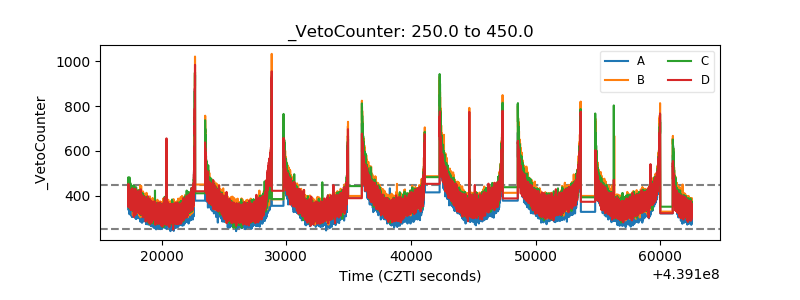 |