| Param | Original file | Final file |
|---|---|---|
| Filename | modeM0/AS1A13_074T12_9000005960cztM0_level2.fits | modeM0/AS1A13_074T12_9000005960cztM0_level2_quad_clean.evt |
| Size (bytes) | 128,030,400 | 96,171,840 |
| Size | 122.1 MB | 91.7 MB |
| Events in quadrant A | 791,002 | 538,144 |
| Events in quadrant B | 728,972 | 491,547 |
| Events in quadrant C | 790,598 | 526,010 |
| Events in quadrant D | 583,056 | 373,907 |
| Mode M9 | |||
|---|---|---|---|
| Quadrant | BADHDUFLAG | Total packets | Discarded packets |
| A | 0 | 37 | 0 |
| B | 0 | 37 | 0 |
| C | 0 | 37 | 0 |
| D | 0 | 37 | 0 |
| Mode M0 | |||
|---|---|---|---|
| Quadrant | BADHDUFLAG | Total packets | Discarded packets |
| A | 0 | 47388 | 0 |
| B | 0 | 44330 | 0 |
| C | 0 | 32810 | 0 |
| D | 0 | 63883 | 0 |
| Mode SS | |||
|---|---|---|---|
| Quadrant | BADHDUFLAG | Total packets | Discarded packets |
| A | 0 | 288 | 0 |
| B | 0 | 288 | 0 |
| C | 0 | 288 | 0 |
| D | 0 | 288 | 0 |
| Quadrant | Total seconds | Saturated seconds | Saturation percentage |
|---|---|---|---|
| A | 14221 | 675 | 4.746502% |
| B | 14221 | 1757 | 12.354968% |
| C | 14221 | 182 | 1.279797% |
| D | 14221 | 3547 | 24.941987% |
Noise dominated data is calculated using 1-second bins in cleaned event files. If a bin has >2000 counts, and if more than 50% of those come from <1% of pixels, then it is considered to be noise-dominated and hence unusable.
| Quadrant | # 1 sec bins | Bins with >0 counts | Bins with >2000 counts | High rate bins dominated by noise | Noise dominated (total time) | Noise dominated (detector-on time) | Marked lightcurve |
|---|---|---|---|---|---|---|---|
| A | 17821 | 14214 | 0 | 0 | 0.00% | 0.00% | 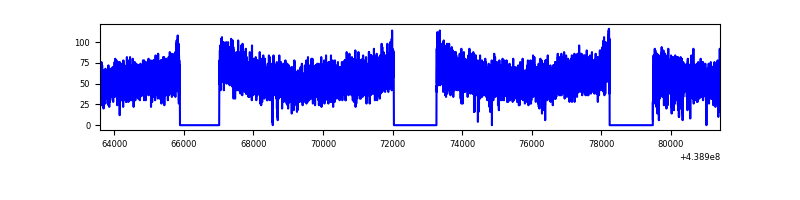 |
| B | 17821 | 14191 | 0 | 0 | 0.00% | 0.00% |  |
| C | 17821 | 14219 | 0 | 0 | 0.00% | 0.00% |  |
| D | 17821 | 14147 | 0 | 0 | 0.00% | 0.00% |  |
Top three noisy pixels from each quadrant. If the there are fewer than three noisy pixels in the level2.evt file, extra rows are filled as -1
| Pixel properties | Quadrant properties | ||||||
|---|---|---|---|---|---|---|---|
| Quadrant | DetID | PixID | Counts | Sigma | Mean | Median | Sigma |
| A | 0 | 29 | 657 | 8.74 | 206 | 194 | 53.0 |
| A | 7 | 110 | 655 | 8.7 | 206 | 194 | 53.0 |
| A | 15 | 236 | 595 | 7.57 | 206 | 194 | 53.0 |
| B | 2 | 9 | 615 | 10.77 | 193 | 184 | 40.0 |
| B | 3 | 17 | 535 | 8.77 | 193 | 184 | 40.0 |
| B | 5 | 128 | 494 | 7.75 | 193 | 184 | 40.0 |
| C | 1 | 81 | 587 | 7.08 | 210 | 196 | 55.2 |
| C | 3 | 202 | 584 | 7.03 | 210 | 196 | 55.2 |
| C | 9 | 188 | 578 | 6.92 | 210 | 196 | 55.2 |
| D | 7 | 3 | 448 | 6.24 | 167 | 152 | 47.4 |
| D | 6 | 67 | 435 | 5.97 | 167 | 152 | 47.4 |
| D | 6 | 79 | 430 | 5.86 | 167 | 152 | 47.4 |
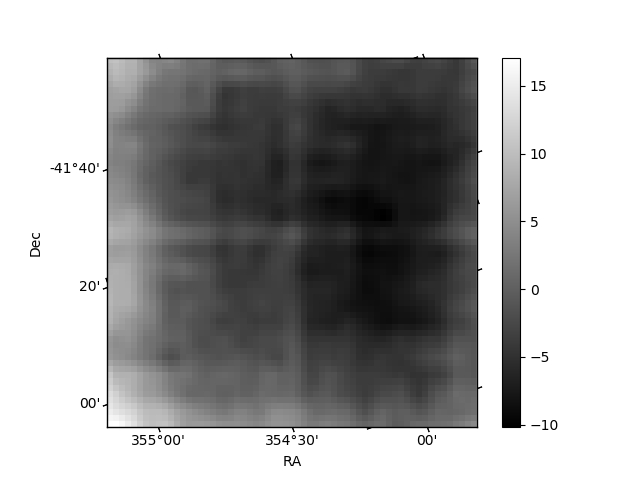
Histogram calculated using DETX and DETY for each event in the final _common_clean file
| Quadrant A | 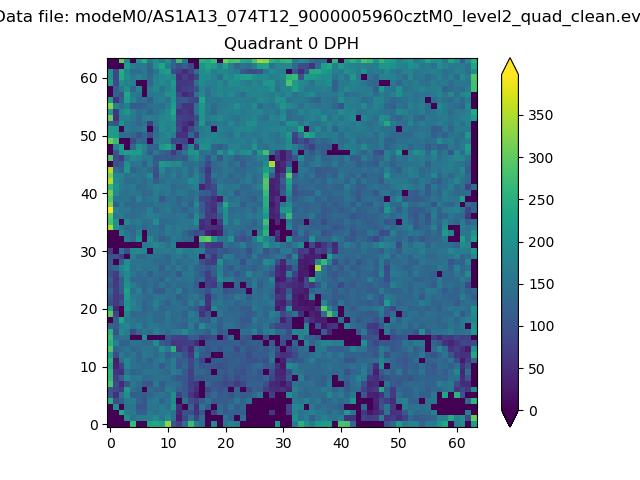 |
 |
Quadrant B |
|---|---|---|---|
| Quadrant D |  |
 |
Quadrant C |
| Plot type | Count rate plots | Images |
|---|---|---|
| Comparison with Poisson distribution Blue bars denote a histogram of data divided into 1 sec bins. Red curve is a Poisson curve with rate = median count rate of data. |
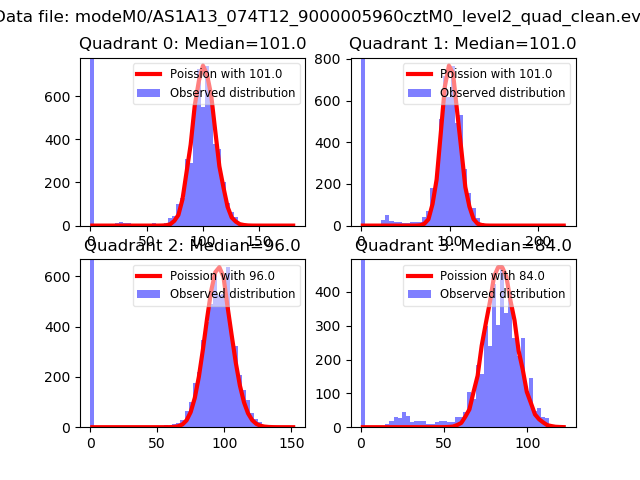 |
 |
| Quadrant-wise count rates Data is divided into 100 sec bins |
 |
|
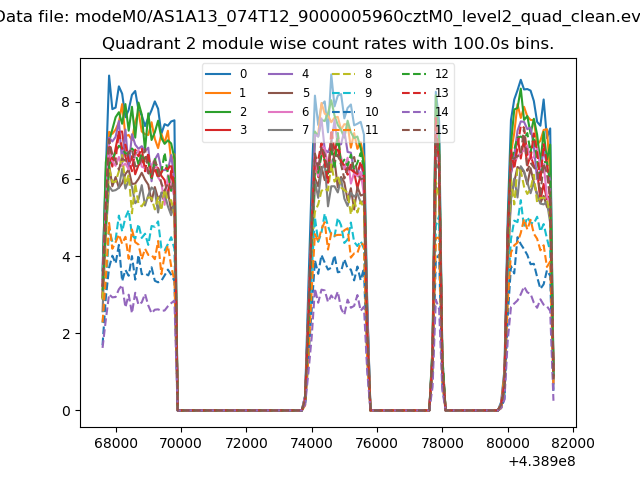
| Module-wise count rates for Quadrant A Data is divided into 100 sec bins |
 |
 |
| Module-wise count rates for Quadrant B Data is divided into 100 sec bins |
 |
 |
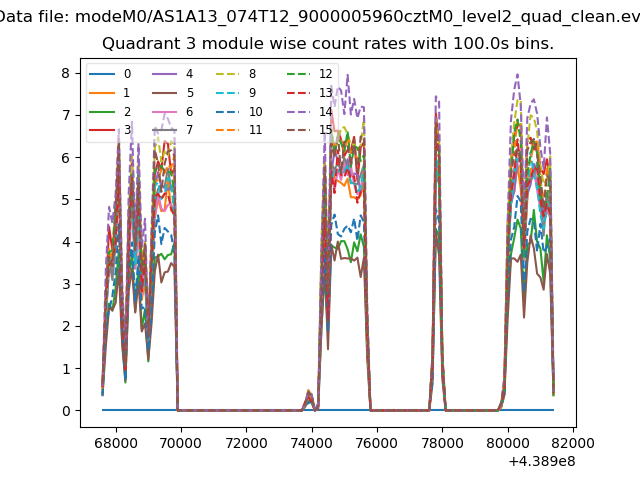
| Module-wise count rates for Quadrant C Data is divided into 100 sec bins |
 |
 |
| Module-wise count rates for Quadrant D Data is divided into 100 sec bins |
 |
 |
| Parameter | Plot |
|---|---|
| CZT HV Monitor |  |
| D_VDD |  |
| Temperature 1 |  |
| Veto HV Monitor |  |
| Veto LLD |  |
| Alpha Counter |  |
| _CPM_Rate |  |
| CZT Counter |  |
| +2.5 Volts monitor | 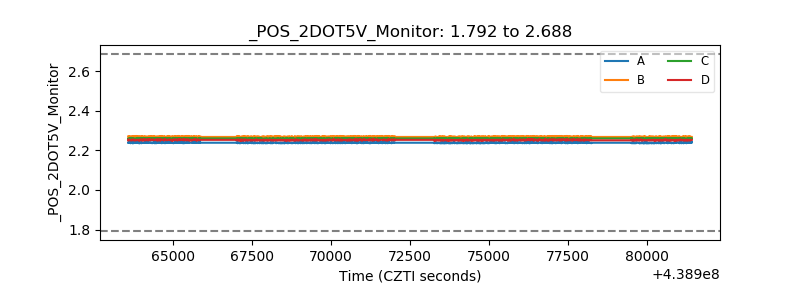 |
| +5 Volts monitor | 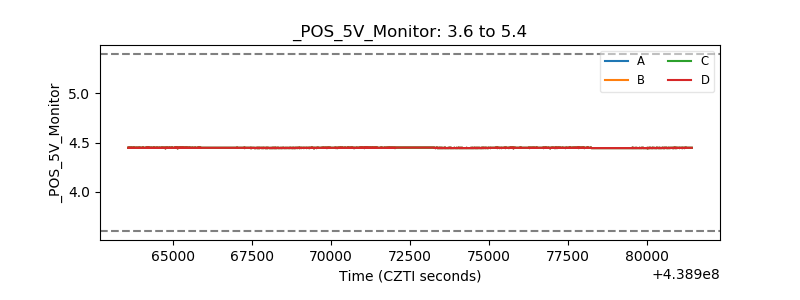 |
| _ROLL_ROT |  |
| _Roll_DEC | 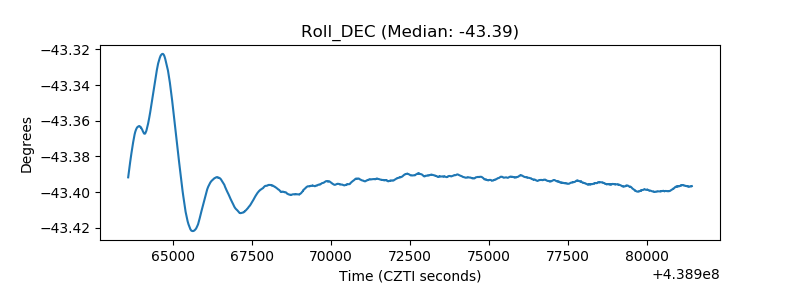 |
| _Roll_RA |  |
| Veto Counter | 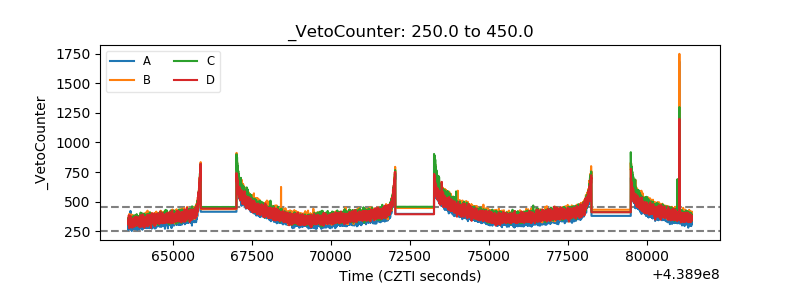 |