| Param | Original file | Final file |
|---|---|---|
| Filename | modeM0/AS1A13_074T05_9000005958cztM0_level2.fits | modeM0/AS1A13_074T05_9000005958cztM0_level2_quad_clean.evt |
| Size (bytes) | 106,940,160 | 106,485,120 |
| Size | 102.0 MB | 101.6 MB |
| Events in quadrant A | 611,866 | 597,278 |
| Events in quadrant B | 618,978 | 632,849 |
| Events in quadrant C | 636,216 | 617,850 |
| Events in quadrant D | 533,412 | 538,787 |
| Mode SS | |||
|---|---|---|---|
| Quadrant | BADHDUFLAG | Total packets | Discarded packets |
| A | 0 | 248 | 0 |
| B | 0 | 250 | 0 |
| C | 0 | 250 | 0 |
| D | 0 | 250 | 0 |
| Mode M0 | |||
|---|---|---|---|
| Quadrant | BADHDUFLAG | Total packets | Discarded packets |
| A | 0 | 46189 | 0 |
| B | 0 | 29755 | 0 |
| C | 0 | 26361 | 0 |
| D | 0 | 34542 | 0 |
| Mode M9 | |||
|---|---|---|---|
| Quadrant | BADHDUFLAG | Total packets | Discarded packets |
| A | 0 | 25 | 0 |
| B | 0 | 24 | 0 |
| C | 0 | 25 | 0 |
| D | 0 | 23 | 0 |
| Quadrant | Total seconds | Saturated seconds | Saturation percentage |
|---|---|---|---|
| A | 12089 | 1208 | 9.992555% |
| B | 12108 | 427 | 3.526594% |
| C | 12102 | 199 | 1.644356% |
| D | 12110 | 861 | 7.109827% |
Noise dominated data is calculated using 1-second bins in cleaned event files. If a bin has >2000 counts, and if more than 50% of those come from <1% of pixels, then it is considered to be noise-dominated and hence unusable.
| Quadrant | # 1 sec bins | Bins with >0 counts | Bins with >2000 counts | High rate bins dominated by noise | Noise dominated (total time) | Noise dominated (detector-on time) | Marked lightcurve |
|---|---|---|---|---|---|---|---|
| A | 17049 | 12123 | 0 | 0 | 0.00% | 0.00% | 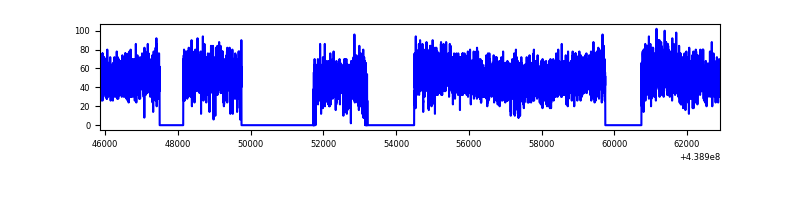 |
| B | 17049 | 12140 | 0 | 0 | 0.00% | 0.00% |  |
| C | 17049 | 12128 | 0 | 0 | 0.00% | 0.00% |  |
| D | 17049 | 12124 | 0 | 0 | 0.00% | 0.00% | 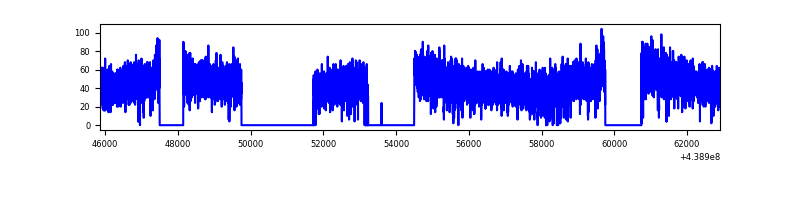 |
Top three noisy pixels from each quadrant. If the there are fewer than three noisy pixels in the level2.evt file, extra rows are filled as -1
| Pixel properties | Quadrant properties | ||||||
|---|---|---|---|---|---|---|---|
| Quadrant | DetID | PixID | Counts | Sigma | Mean | Median | Sigma |
| A | 0 | 29 | 501 | 8.33 | 159 | 149 | 42.3 |
| A | 7 | 110 | 496 | 8.21 | 159 | 149 | 42.3 |
| A | 15 | 236 | 490 | 8.07 | 159 | 149 | 42.3 |
| B | 2 | 9 | 555 | 11.34 | 163 | 155 | 35.3 |
| B | 2 | 8 | 477 | 9.13 | 163 | 155 | 35.3 |
| B | 3 | 17 | 451 | 8.39 | 163 | 155 | 35.3 |
| C | 3 | 202 | 510 | 7.77 | 168 | 156 | 45.6 |
| C | 1 | 81 | 503 | 7.62 | 168 | 156 | 45.6 |
| C | 1 | 80 | 485 | 7.22 | 168 | 156 | 45.6 |
| D | 6 | 231 | 401 | 5.97 | 153 | 139 | 43.9 |
| D | 10 | 63 | 391 | 5.74 | 153 | 139 | 43.9 |
| D | 7 | 3 | 385 | 5.6 | 153 | 139 | 43.9 |
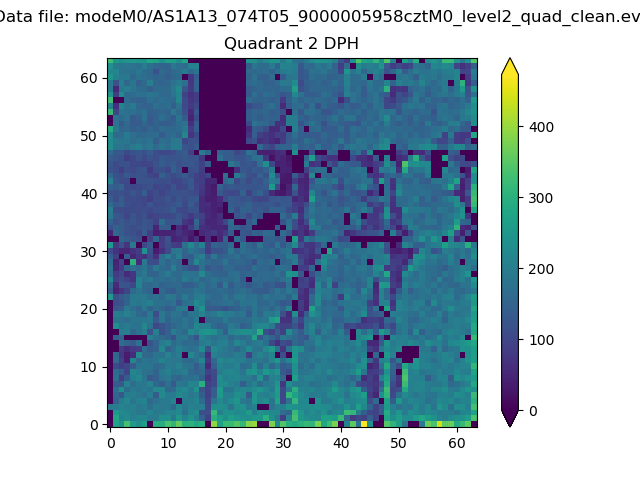
Histogram calculated using DETX and DETY for each event in the final _common_clean file
| Quadrant A |  |
 |
Quadrant B |
|---|---|---|---|
| Quadrant D | 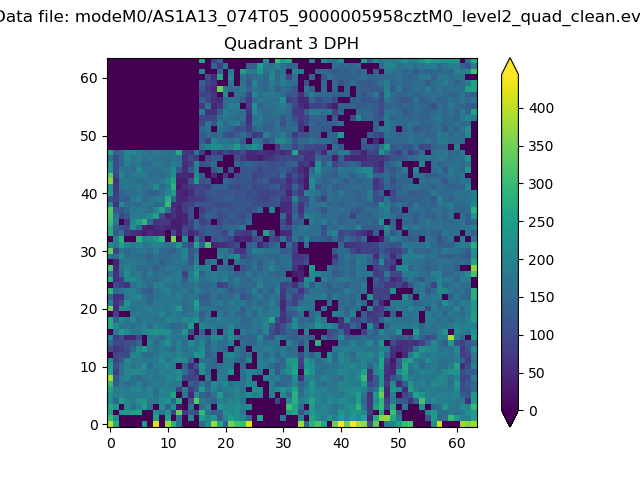 |
 |
Quadrant C |
| Plot type | Count rate plots | Images |
|---|---|---|
| Comparison with Poisson distribution Blue bars denote a histogram of data divided into 1 sec bins. Red curve is a Poisson curve with rate = median count rate of data. |
 |
 |
| Quadrant-wise count rates Data is divided into 100 sec bins |
 |
|
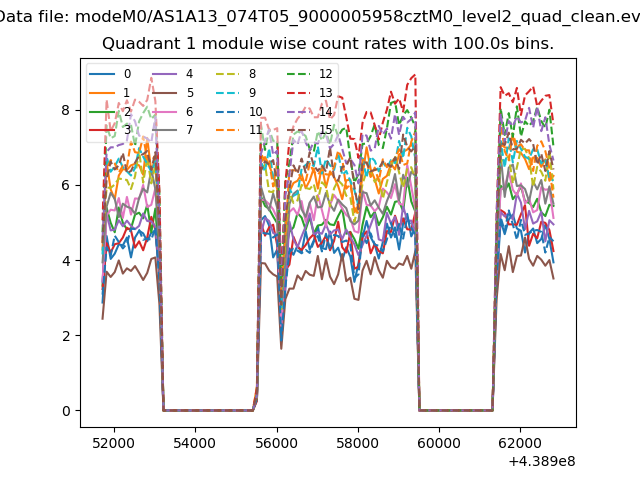
| Module-wise count rates for Quadrant A Data is divided into 100 sec bins |
 |
 |
| Module-wise count rates for Quadrant B Data is divided into 100 sec bins |
 |
 |
| Module-wise count rates for Quadrant C Data is divided into 100 sec bins |
 |
 |
| Module-wise count rates for Quadrant D Data is divided into 100 sec bins |
 |
 |
| Parameter | Plot |
|---|---|
| CZT HV Monitor | 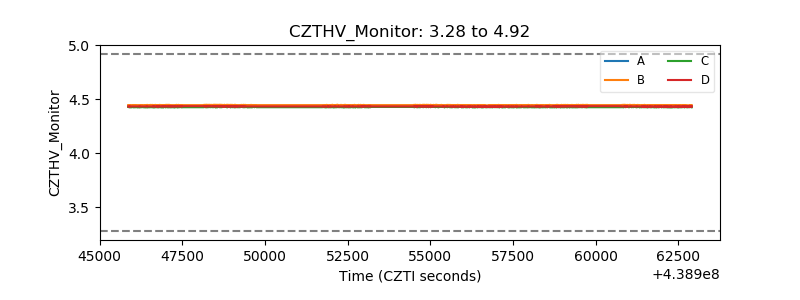 |
| D_VDD |  |
| Temperature 1 |  |
| Veto HV Monitor |  |
| Veto LLD | 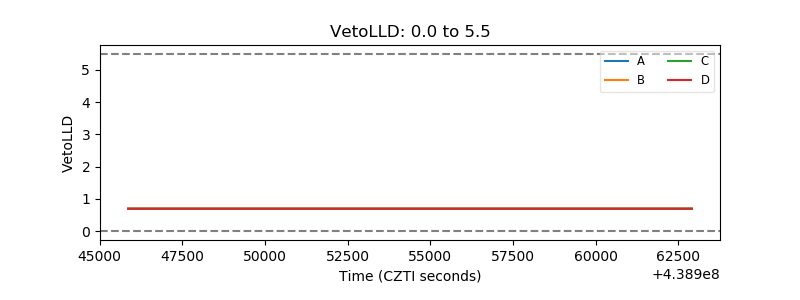 |
| Alpha Counter |  |
| _CPM_Rate |  |
| CZT Counter |  |
| +2.5 Volts monitor |  |
| +5 Volts monitor |  |
| _ROLL_ROT |  |
| _Roll_DEC | 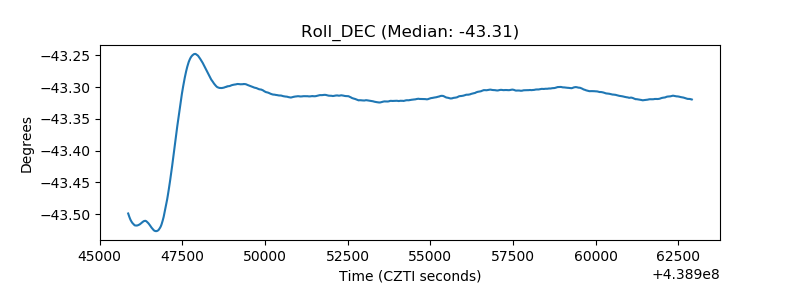 |
| _Roll_RA |  |
| Veto Counter | 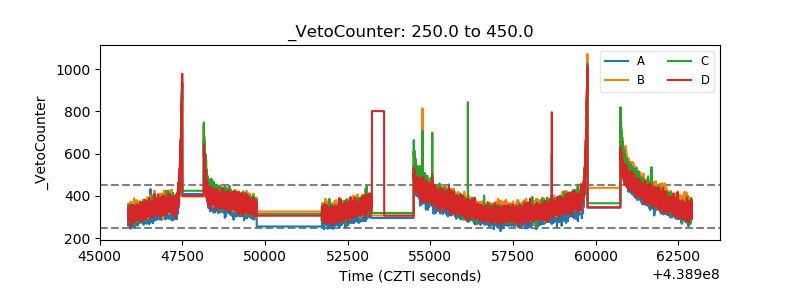 |