| Param | Original file | Final file |
|---|---|---|
| Filename | modeM0/AS1A13_074T04_9000005962cztM0_level2.fits | modeM0/AS1A13_074T04_9000005962cztM0_level2_quad_clean.evt |
| Size (bytes) | 181,526,400 | 163,656,000 |
| Size | 173.1 MB | 156.1 MB |
| Events in quadrant A | 1,025,246 | 873,060 |
| Events in quadrant B | 1,066,516 | 967,288 |
| Events in quadrant C | 1,087,854 | 906,642 |
| Events in quadrant D | 920,334 | 812,161 |
| Mode SS | |||
|---|---|---|---|
| Quadrant | BADHDUFLAG | Total packets | Discarded packets |
| A | 0 | 412 | 0 |
| B | 0 | 412 | 0 |
| C | 0 | 412 | 0 |
| D | 0 | 412 | 0 |
| Mode M0 | |||
|---|---|---|---|
| Quadrant | BADHDUFLAG | Total packets | Discarded packets |
| A | 0 | 74855 | 0 |
| B | 0 | 47011 | 0 |
| C | 0 | 44269 | 0 |
| D | 0 | 55956 | 0 |
| Mode M9 | |||
|---|---|---|---|
| Quadrant | BADHDUFLAG | Total packets | Discarded packets |
| A | 0 | 28 | 0 |
| B | 0 | 28 | 0 |
| C | 0 | 28 | 0 |
| D | 0 | 28 | 0 |
| Quadrant | Total seconds | Saturated seconds | Saturation percentage |
|---|---|---|---|
| A | 20269 | 2469 | 12.181163% |
| B | 20269 | 463 | 2.284276% |
| C | 20269 | 205 | 1.011397% |
| D | 20269 | 1138 | 5.614485% |
Noise dominated data is calculated using 1-second bins in cleaned event files. If a bin has >2000 counts, and if more than 50% of those come from <1% of pixels, then it is considered to be noise-dominated and hence unusable.
| Quadrant | # 1 sec bins | Bins with >0 counts | Bins with >2000 counts | High rate bins dominated by noise | Noise dominated (total time) | Noise dominated (detector-on time) | Marked lightcurve |
|---|---|---|---|---|---|---|---|
| A | 23110 | 20132 | 0 | 0 | 0.00% | 0.00% |  |
| B | 23110 | 20268 | 0 | 0 | 0.00% | 0.00% |  |
| C | 23110 | 20270 | 0 | 0 | 0.00% | 0.00% |  |
| D | 23110 | 20251 | 0 | 0 | 0.00% | 0.00% |  |
Top three noisy pixels from each quadrant. If the there are fewer than three noisy pixels in the level2.evt file, extra rows are filled as -1
| Pixel properties | Quadrant properties | ||||||
|---|---|---|---|---|---|---|---|
| Quadrant | DetID | PixID | Counts | Sigma | Mean | Median | Sigma |
| A | 7 | 110 | 882 | 9.0 | 267 | 250 | 70.2 |
| A | 15 | 236 | 838 | 8.37 | 267 | 250 | 70.2 |
| A | 0 | 29 | 831 | 8.27 | 267 | 250 | 70.2 |
| B | 2 | 9 | 979 | 12.08 | 281 | 267 | 58.9 |
| B | 2 | 8 | 776 | 8.64 | 281 | 267 | 58.9 |
| B | 3 | 17 | 759 | 8.35 | 281 | 267 | 58.9 |
| C | 1 | 81 | 851 | 7.75 | 288 | 268 | 75.2 |
| C | 1 | 80 | 844 | 7.66 | 288 | 268 | 75.2 |
| C | 3 | 202 | 840 | 7.6 | 288 | 268 | 75.2 |
| D | 8 | 176 | 805 | 7.53 | 263 | 239 | 75.2 |
| D | 6 | 79 | 722 | 6.42 | 263 | 239 | 75.2 |
| D | 8 | 192 | 691 | 6.01 | 263 | 239 | 75.2 |
Histogram calculated using DETX and DETY for each event in the final _common_clean file
| Quadrant A |  |
 |
Quadrant B |
|---|---|---|---|
| Quadrant D |  |
 |
Quadrant C |
| Plot type | Count rate plots | Images |
|---|---|---|
| Comparison with Poisson distribution Blue bars denote a histogram of data divided into 1 sec bins. Red curve is a Poisson curve with rate = median count rate of data. |
 |
 |
| Quadrant-wise count rates Data is divided into 100 sec bins |
 |
|
| Module-wise count rates for Quadrant A Data is divided into 100 sec bins |
 |
 |
| Module-wise count rates for Quadrant B Data is divided into 100 sec bins |
 |
 |
| Module-wise count rates for Quadrant C Data is divided into 100 sec bins |
 |
 |
| Module-wise count rates for Quadrant D Data is divided into 100 sec bins |
 |
 |
| Parameter | Plot |
|---|---|
| CZT HV Monitor |  |
| D_VDD |  |
| Temperature 1 |  |
| Veto HV Monitor |  |
| Veto LLD |  |
| Alpha Counter |  |
| _CPM_Rate |  |
| CZT Counter |  |
| +2.5 Volts monitor |  |
| +5 Volts monitor |  |
| _ROLL_ROT | 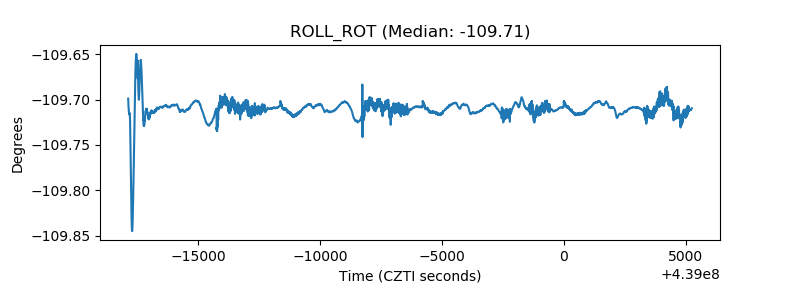 |
| _Roll_DEC |  |
| _Roll_RA |  |
| Veto Counter |  |