| Param | Original file | Final file |
|---|---|---|
| Filename | modeM0/AS1A13_012T02_9000005950cztM0_level2.fits | modeM0/AS1A13_012T02_9000005950cztM0_level2_quad_clean.evt |
| Size (bytes) | 1,258,260,480 | 1,270,094,400 |
| Size | 1.2 GB | 1.2 GB |
| Events in quadrant A | 7,018,418 | 6,982,510 |
| Events in quadrant B | 7,382,372 | 7,808,306 |
| Events in quadrant C | 7,668,312 | 7,552,214 |
| Events in quadrant D | 6,300,978 | 6,400,743 |
| Mode M9 | |||
|---|---|---|---|
| Quadrant | BADHDUFLAG | Total packets | Discarded packets |
| A | 0 | 173 | 0 |
| B | 0 | 173 | 0 |
| C | 0 | 173 | 0 |
| D | 0 | 173 | 0 |
| Mode SS | |||
|---|---|---|---|
| Quadrant | BADHDUFLAG | Total packets | Discarded packets |
| A | 0 | 2878 | 0 |
| B | 0 | 2874 | 0 |
| C | 0 | 2876 | 0 |
| D | 0 | 2875 | 0 |
| Mode M0 | |||
|---|---|---|---|
| Quadrant | BADHDUFLAG | Total packets | Discarded packets |
| A | 0 | 497268 | 0 |
| B | 0 | 317433 | 0 |
| C | 0 | 306581 | 0 |
| D | 0 | 423843 | 0 |
| Quadrant | Total seconds | Saturated seconds | Saturation percentage |
|---|---|---|---|
| A | 141888 | 19463 | 13.717157% |
| B | 141884 | 3521 | 2.481605% |
| C | 141887 | 1615 | 1.138230% |
| D | 141859 | 10578 | 7.456700% |
Noise dominated data is calculated using 1-second bins in cleaned event files. If a bin has >2000 counts, and if more than 50% of those come from <1% of pixels, then it is considered to be noise-dominated and hence unusable.
| Quadrant | # 1 sec bins | Bins with >0 counts | Bins with >2000 counts | High rate bins dominated by noise | Noise dominated (total time) | Noise dominated (detector-on time) | Marked lightcurve |
|---|---|---|---|---|---|---|---|
| A | 161167 | 141693 | 0 | 0 | 0.00% | 0.00% |  |
| B | 161168 | 141867 | 0 | 0 | 0.00% | 0.00% |  |
| C | 161168 | 141900 | 0 | 0 | 0.00% | 0.00% |  |
| D | 161168 | 141683 | 0 | 0 | 0.00% | 0.00% |  |
Top three noisy pixels from each quadrant. If the there are fewer than three noisy pixels in the level2.evt file, extra rows are filled as -1
| Pixel properties | Quadrant properties | ||||||
|---|---|---|---|---|---|---|---|
| Quadrant | DetID | PixID | Counts | Sigma | Mean | Median | Sigma |
| A | 7 | 110 | 5845 | 8.92 | 1834 | 1712 | 463.4 |
| A | 0 | 29 | 5565 | 8.32 | 1834 | 1712 | 463.4 |
| A | 15 | 236 | 5525 | 8.23 | 1834 | 1712 | 463.4 |
| B | 2 | 9 | 6725 | 12.46 | 1950 | 1847 | 391.4 |
| B | 2 | 8 | 5384 | 9.04 | 1950 | 1847 | 391.4 |
| B | 3 | 17 | 5362 | 8.98 | 1950 | 1847 | 391.4 |
| C | 3 | 202 | 6056 | 8.01 | 2028 | 1882 | 521.3 |
| C | 1 | 81 | 5725 | 7.37 | 2028 | 1882 | 521.3 |
| C | 3 | 203 | 5674 | 7.27 | 2028 | 1882 | 521.3 |
| D | 10 | 189 | 4693 | 6.02 | 1816 | 1650 | 505.2 |
| D | 6 | 79 | 4592 | 5.82 | 1816 | 1650 | 505.2 |
| D | 7 | 3 | 4515 | 5.67 | 1816 | 1650 | 505.2 |
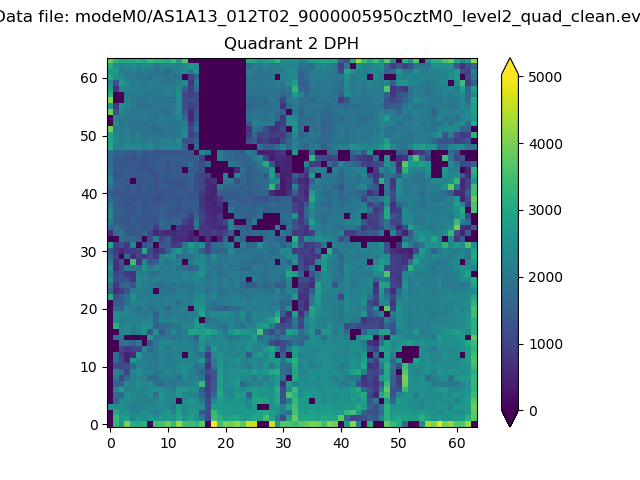
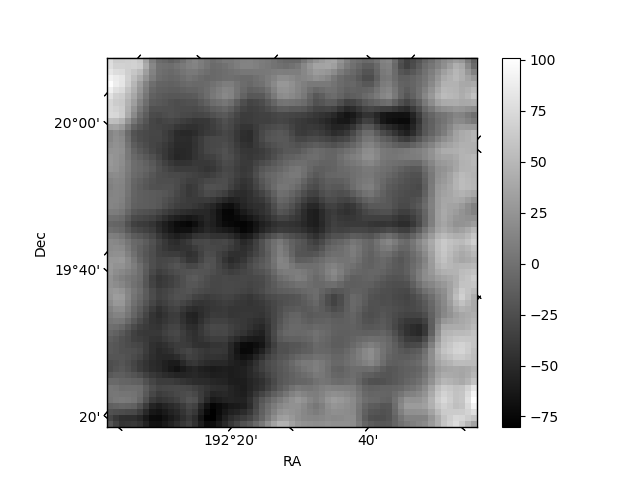
Histogram calculated using DETX and DETY for each event in the final _common_clean file
| Quadrant A |  |
 |
Quadrant B |
|---|---|---|---|
| Quadrant D |  |
 |
Quadrant C |
| Plot type | Count rate plots | Images |
|---|---|---|
| Comparison with Poisson distribution Blue bars denote a histogram of data divided into 1 sec bins. Red curve is a Poisson curve with rate = median count rate of data. |
 |
 |
| Quadrant-wise count rates Data is divided into 100 sec bins |
 |
|
| Module-wise count rates for Quadrant A Data is divided into 100 sec bins |
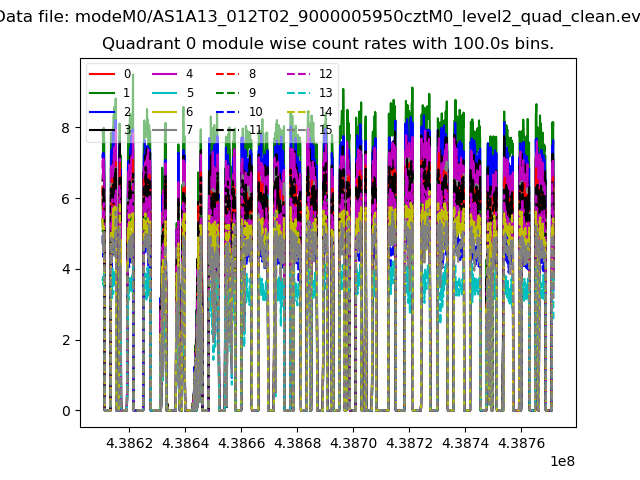 |
 |
| Module-wise count rates for Quadrant B Data is divided into 100 sec bins |
 |
 |
| Module-wise count rates for Quadrant C Data is divided into 100 sec bins |
 |
 |
| Module-wise count rates for Quadrant D Data is divided into 100 sec bins |
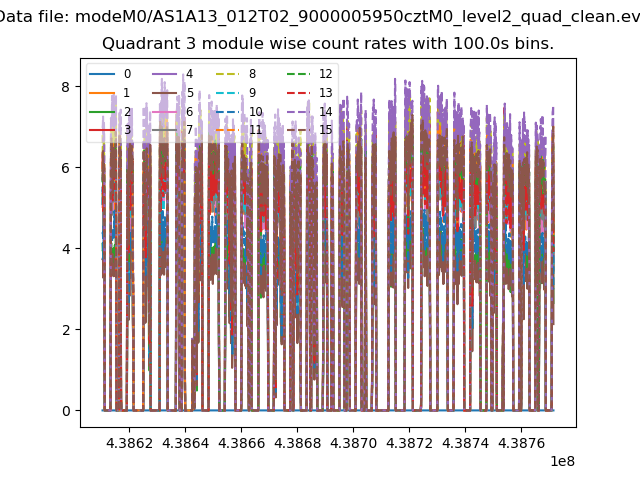 |
 |
| Parameter | Plot |
|---|---|
| CZT HV Monitor |  |
| D_VDD |  |
| Temperature 1 | 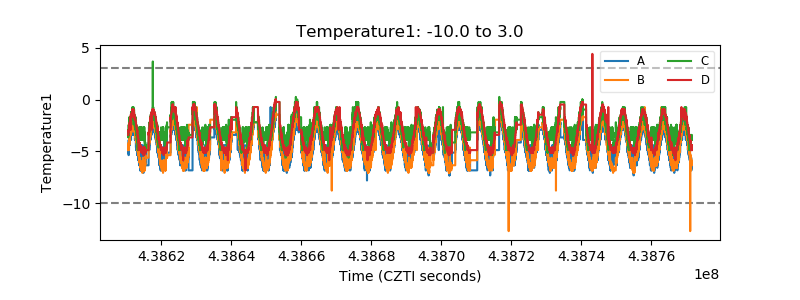 |
| Veto HV Monitor | 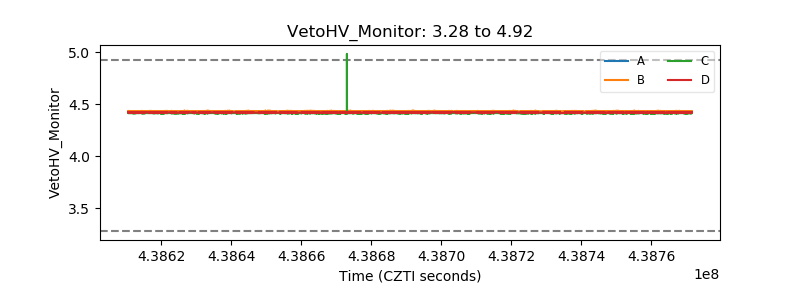 |
| Veto LLD |  |
| Alpha Counter |  |
| _CPM_Rate |  |
| CZT Counter |  |
| +2.5 Volts monitor | 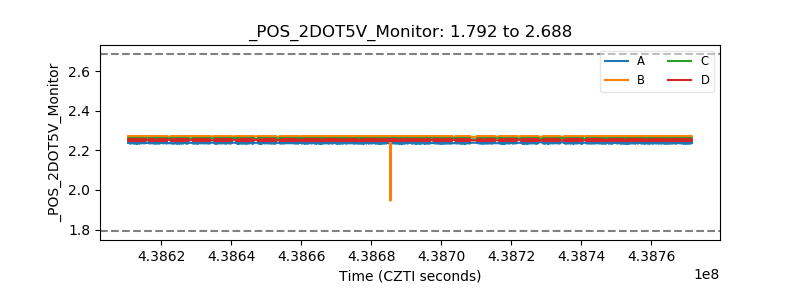 |
| +5 Volts monitor |  |
| _ROLL_ROT |  |
| _Roll_DEC |  |
| _Roll_RA |  |
| Veto Counter |  |