| Param | Original file | Final file |
|---|---|---|
| Filename | modeM0/AS1A13_038T01_9000005944cztM0_level2.fits | modeM0/AS1A13_038T01_9000005944cztM0_level2_quad_clean.evt |
| Size (bytes) | 368,648,640 | 378,570,240 |
| Size | 351.6 MB | 361.0 MB |
| Events in quadrant A | 1,053,642 | 729,827 |
| Events in quadrant B | 2,405,314 | 2,725,381 |
| Events in quadrant C | 2,511,704 | 2,609,465 |
| Events in quadrant D | 2,046,032 | 2,270,529 |
| Mode SS | |||
|---|---|---|---|
| Quadrant | BADHDUFLAG | Total packets | Discarded packets |
| A | 0 | 930 | 0 |
| B | 0 | 930 | 0 |
| C | 0 | 930 | 0 |
| D | 0 | 930 | 0 |
| Mode M9 | |||
|---|---|---|---|
| Quadrant | BADHDUFLAG | Total packets | Discarded packets |
| A | 0 | 83 | 0 |
| B | 0 | 83 | 0 |
| C | 0 | 83 | 0 |
| D | 0 | 83 | 0 |
| Mode M0 | |||
|---|---|---|---|
| Quadrant | BADHDUFLAG | Total packets | Discarded packets |
| A | 0 | 298039 | 0 |
| B | 0 | 108869 | 0 |
| C | 0 | 95815 | 0 |
| D | 0 | 143942 | 0 |
| Quadrant | Total seconds | Saturated seconds | Saturation percentage |
|---|---|---|---|
| A | 45567 | 35772 | 78.504181% |
| B | 45568 | 1711 | 3.754828% |
| C | 45567 | 282 | 0.618869% |
| D | 45566 | 3467 | 7.608743% |
Noise dominated data is calculated using 1-second bins in cleaned event files. If a bin has >2000 counts, and if more than 50% of those come from <1% of pixels, then it is considered to be noise-dominated and hence unusable.
| Quadrant | # 1 sec bins | Bins with >0 counts | Bins with >2000 counts | High rate bins dominated by noise | Noise dominated (total time) | Noise dominated (detector-on time) | Marked lightcurve |
|---|---|---|---|---|---|---|---|
| A | 53928 | 39965 | 0 | 0 | 0.00% | 0.00% |  |
| B | 53928 | 45567 | 0 | 0 | 0.00% | 0.00% |  |
| C | 53928 | 45569 | 0 | 0 | 0.00% | 0.00% |  |
| D | 53928 | 45524 | 0 | 0 | 0.00% | 0.00% |  |
Top three noisy pixels from each quadrant. If the there are fewer than three noisy pixels in the level2.evt file, extra rows are filled as -1
| Pixel properties | Quadrant properties | ||||||
|---|---|---|---|---|---|---|---|
| Quadrant | DetID | PixID | Counts | Sigma | Mean | Median | Sigma |
| A | 7 | 110 | 889 | 8.78 | 275 | 258 | 71.9 |
| A | 0 | 29 | 856 | 8.32 | 275 | 258 | 71.9 |
| A | 14 | 95 | 823 | 7.86 | 275 | 258 | 71.9 |
| B | 2 | 9 | 2145 | 12.01 | 637 | 605 | 128.3 |
| B | 3 | 17 | 1785 | 9.2 | 637 | 605 | 128.3 |
| B | 2 | 8 | 1737 | 8.83 | 637 | 605 | 128.3 |
| C | 1 | 81 | 1934 | 7.74 | 664 | 620 | 169.8 |
| C | 3 | 202 | 1903 | 7.56 | 664 | 620 | 169.8 |
| C | 1 | 80 | 1882 | 7.43 | 664 | 620 | 169.8 |
| D | 6 | 79 | 1583 | 6.31 | 589 | 534 | 166.2 |
| D | 3 | 14 | 1509 | 5.87 | 589 | 534 | 166.2 |
| D | 10 | 189 | 1502 | 5.82 | 589 | 534 | 166.2 |
Histogram calculated using DETX and DETY for each event in the final _common_clean file
| Quadrant A | 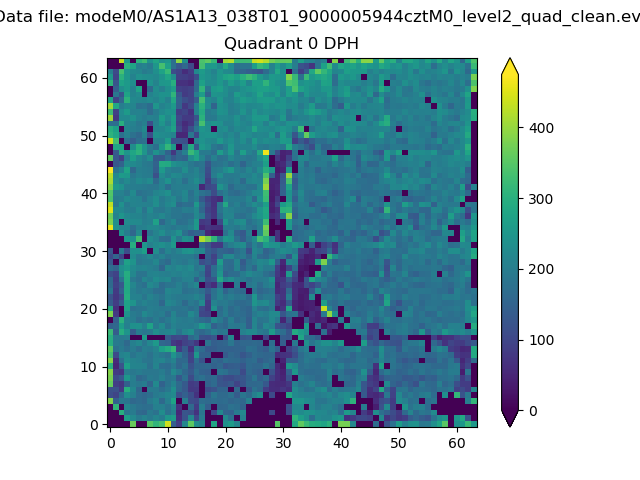 |
 |
Quadrant B |
|---|---|---|---|
| Quadrant D |  |
 |
Quadrant C |
| Plot type | Count rate plots | Images |
|---|---|---|
| Comparison with Poisson distribution Blue bars denote a histogram of data divided into 1 sec bins. Red curve is a Poisson curve with rate = median count rate of data. |
 |
 |
| Quadrant-wise count rates Data is divided into 100 sec bins |
 |
|
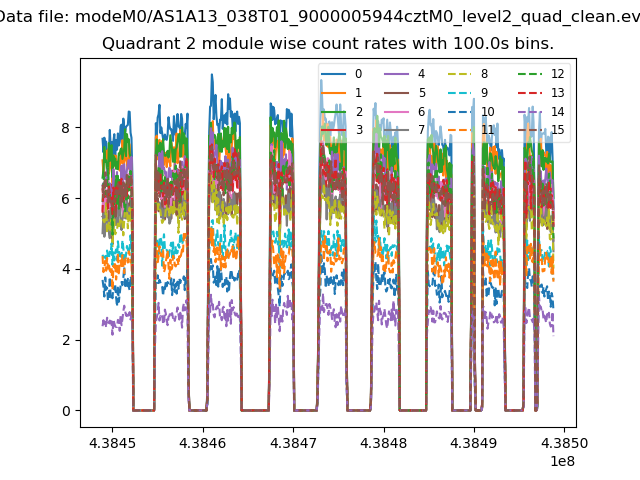
| Module-wise count rates for Quadrant A Data is divided into 100 sec bins |
 |
 |
| Module-wise count rates for Quadrant B Data is divided into 100 sec bins |
 |
 |
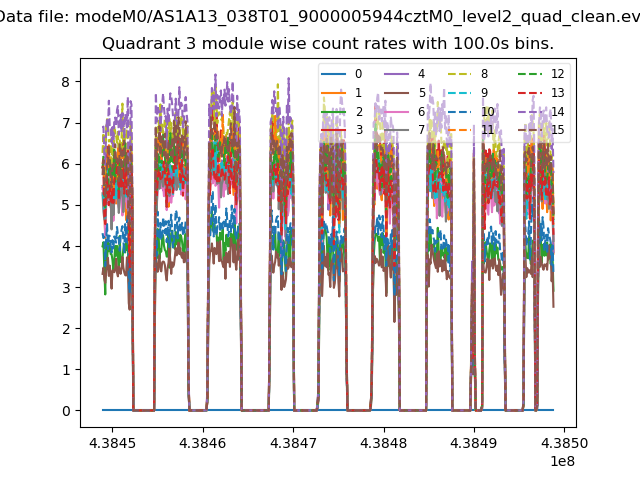
| Module-wise count rates for Quadrant C Data is divided into 100 sec bins |
 |
 |
| Module-wise count rates for Quadrant D Data is divided into 100 sec bins |
 |
 |
| Parameter | Plot |
|---|---|
| CZT HV Monitor |  |
| D_VDD |  |
| Temperature 1 | 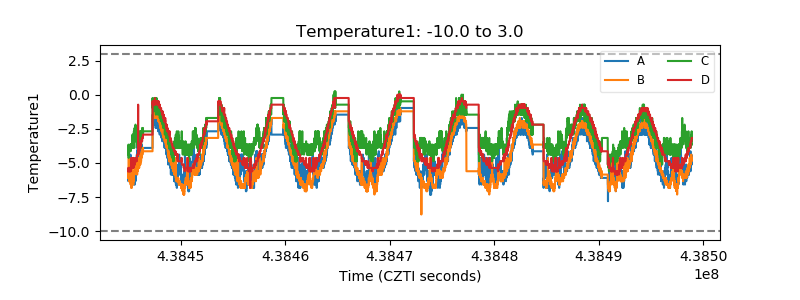 |
| Veto HV Monitor | 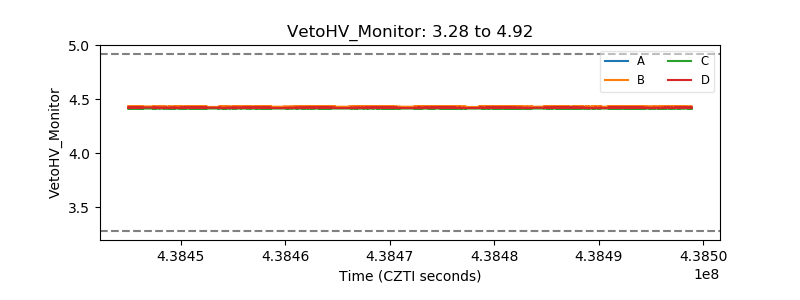 |
| Veto LLD |  |
| Alpha Counter | 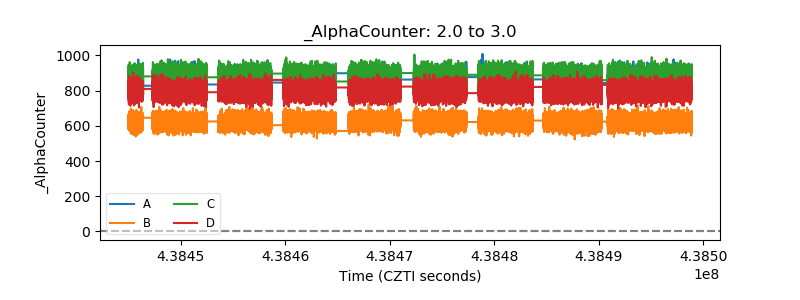 |
| _CPM_Rate |  |
| CZT Counter |  |
| +2.5 Volts monitor |  |
| +5 Volts monitor |  |
| _ROLL_ROT |  |
| _Roll_DEC | 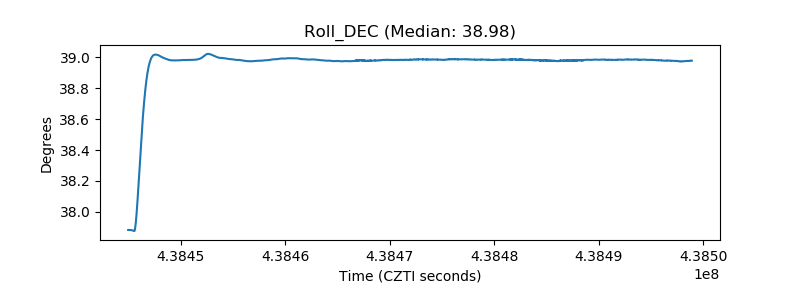 |
| _Roll_RA | 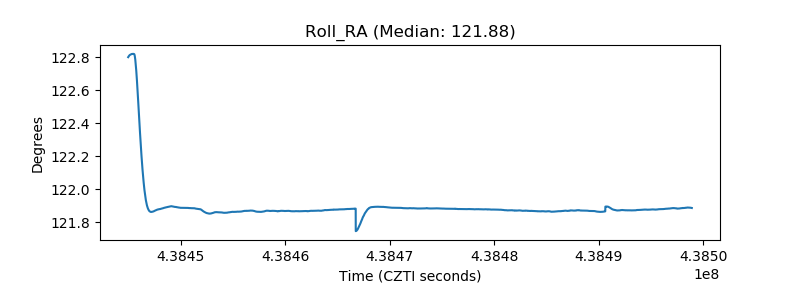 |
| Veto Counter |  |