| Param | Original file | Final file |
|---|---|---|
| Filename | modeM0/AS1A13_029T01_9000005940cztM0_level2.fits | modeM0/AS1A13_029T01_9000005940cztM0_level2_quad_clean.evt |
| Size (bytes) | 1,299,634,560 | 1,303,585,920 |
| Size | 1.2 GB | 1.2 GB |
| Events in quadrant A | 7,728,682 | 7,812,379 |
| Events in quadrant B | 7,641,386 | 8,013,536 |
| Events in quadrant C | 7,716,220 | 7,353,539 |
| Events in quadrant D | 6,389,328 | 6,424,129 |
| Mode SS | |||
|---|---|---|---|
| Quadrant | BADHDUFLAG | Total packets | Discarded packets |
| A | 0 | 2926 | 0 |
| B | 0 | 2926 | 0 |
| C | 0 | 2926 | 0 |
| D | 0 | 2926 | 0 |
| Mode M0 | |||
|---|---|---|---|
| Quadrant | BADHDUFLAG | Total packets | Discarded packets |
| A | 0 | 383149 | 0 |
| B | 0 | 297227 | 0 |
| C | 0 | 322475 | 0 |
| D | 0 | 420470 | 0 |
| Mode M9 | |||
|---|---|---|---|
| Quadrant | BADHDUFLAG | Total packets | Discarded packets |
| A | 0 | 183 | 0 |
| B | 0 | 183 | 0 |
| C | 0 | 183 | 0 |
| D | 0 | 183 | 0 |
| Quadrant | Total seconds | Saturated seconds | Saturation percentage |
|---|---|---|---|
| A | 144173 | 3097 | 2.148114% |
| B | 144173 | 2111 | 1.464213% |
| C | 144173 | 3073 | 2.131467% |
| D | 144173 | 11589 | 8.038260% |
Noise dominated data is calculated using 1-second bins in cleaned event files. If a bin has >2000 counts, and if more than 50% of those come from <1% of pixels, then it is considered to be noise-dominated and hence unusable.
| Quadrant | # 1 sec bins | Bins with >0 counts | Bins with >2000 counts | High rate bins dominated by noise | Noise dominated (total time) | Noise dominated (detector-on time) | Marked lightcurve |
|---|---|---|---|---|---|---|---|
| A | 162193 | 144174 | 0 | 0 | 0.00% | 0.00% |  |
| B | 162193 | 144172 | 0 | 0 | 0.00% | 0.00% | 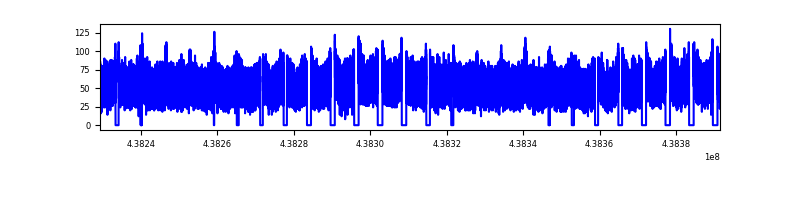 |
| C | 162193 | 144016 | 0 | 0 | 0.00% | 0.00% |  |
| D | 162193 | 143621 | 0 | 0 | 0.00% | 0.00% |  |
Top three noisy pixels from each quadrant. If the there are fewer than three noisy pixels in the level2.evt file, extra rows are filled as -1
| Pixel properties | Quadrant properties | ||||||
|---|---|---|---|---|---|---|---|
| Quadrant | DetID | PixID | Counts | Sigma | Mean | Median | Sigma |
| A | 7 | 110 | 6601 | 9.14 | 2018 | 1877 | 516.8 |
| A | 15 | 236 | 6163 | 8.29 | 2018 | 1877 | 516.8 |
| A | 0 | 29 | 6062 | 8.1 | 2018 | 1877 | 516.8 |
| B | 2 | 9 | 7014 | 12.7 | 2010 | 1905 | 402.2 |
| B | 3 | 17 | 5670 | 9.36 | 2010 | 1905 | 402.2 |
| B | 2 | 8 | 5653 | 9.32 | 2010 | 1905 | 402.2 |
| C | 1 | 80 | 5841 | 7.46 | 2042 | 1894 | 528.9 |
| C | 1 | 81 | 5841 | 7.46 | 2042 | 1894 | 528.9 |
| C | 3 | 202 | 5816 | 7.42 | 2042 | 1894 | 528.9 |
| D | 6 | 79 | 4636 | 5.83 | 1834 | 1661 | 510.7 |
| D | 3 | 14 | 4592 | 5.74 | 1834 | 1661 | 510.7 |
| D | 6 | 38 | 4577 | 5.71 | 1834 | 1661 | 510.7 |
Histogram calculated using DETX and DETY for each event in the final _common_clean file
| Quadrant A |  |
 |
Quadrant B |
|---|---|---|---|
| Quadrant D |  |
 |
Quadrant C |
| Plot type | Count rate plots | Images |
|---|---|---|
| Comparison with Poisson distribution Blue bars denote a histogram of data divided into 1 sec bins. Red curve is a Poisson curve with rate = median count rate of data. |
 |
 |
| Quadrant-wise count rates Data is divided into 100 sec bins |
 |
|
| Module-wise count rates for Quadrant A Data is divided into 100 sec bins |
 |
 |
| Module-wise count rates for Quadrant B Data is divided into 100 sec bins |
 |
 |
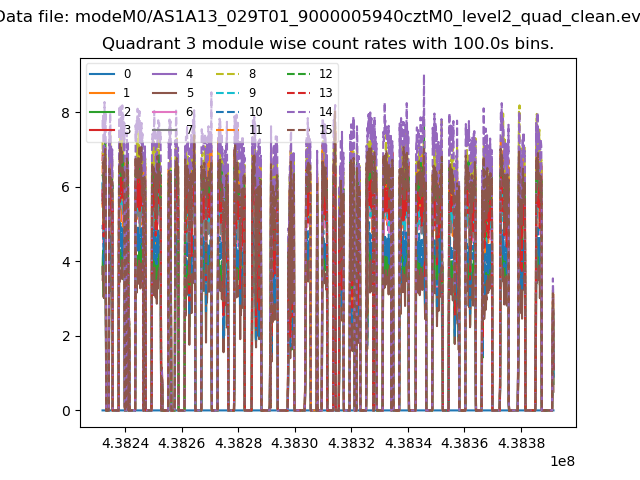
| Module-wise count rates for Quadrant C Data is divided into 100 sec bins |
 |
 |
| Module-wise count rates for Quadrant D Data is divided into 100 sec bins |
 |
 |
| Parameter | Plot |
|---|---|
| CZT HV Monitor |  |
| D_VDD |  |
| Temperature 1 |  |
| Veto HV Monitor |  |
| Veto LLD | 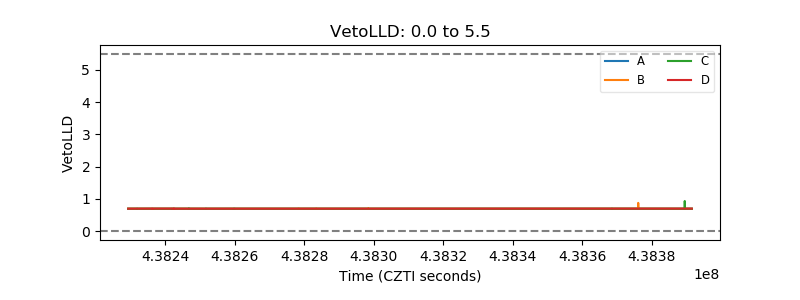 |
| Alpha Counter |  |
| _CPM_Rate |  |
| CZT Counter | 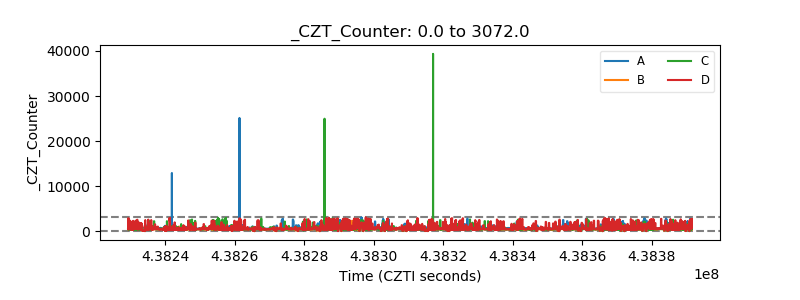 |
| +2.5 Volts monitor |  |
| +5 Volts monitor | 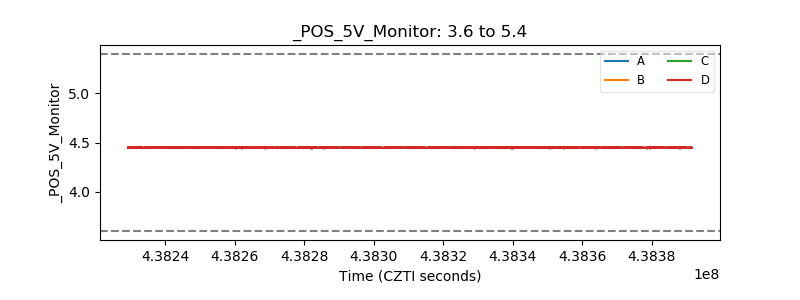 |
| _ROLL_ROT |  |
| _Roll_DEC |  |
| _Roll_RA |  |
| Veto Counter |  |