| Param | Original file | Final file |
|---|---|---|
| Filename | modeM0/AS1A13_025T01_9000005936cztM0_level2.fits | modeM0/AS1A13_025T01_9000005936cztM0_level2_quad_clean.evt |
| Size (bytes) | 473,757,120 | 439,128,000 |
| Size | 451.8 MB | 418.8 MB |
| Events in quadrant A | 2,771,662 | 2,454,655 |
| Events in quadrant B | 2,766,020 | 2,614,088 |
| Events in quadrant C | 2,838,784 | 2,488,403 |
| Events in quadrant D | 2,337,342 | 2,110,026 |
| Mode M9 | |||
|---|---|---|---|
| Quadrant | BADHDUFLAG | Total packets | Discarded packets |
| A | 0 | 85 | 0 |
| B | 0 | 85 | 0 |
| C | 0 | 85 | 0 |
| D | 0 | 85 | 0 |
| Mode M0 | |||
|---|---|---|---|
| Quadrant | BADHDUFLAG | Total packets | Discarded packets |
| A | 0 | 156971 | 0 |
| B | 0 | 113781 | 0 |
| C | 0 | 123178 | 0 |
| D | 0 | 167522 | 0 |
| Mode SS | |||
|---|---|---|---|
| Quadrant | BADHDUFLAG | Total packets | Discarded packets |
| A | 0 | 1074 | 0 |
| B | 0 | 1074 | 0 |
| C | 0 | 1074 | 0 |
| D | 0 | 1074 | 0 |
| Quadrant | Total seconds | Saturated seconds | Saturation percentage |
|---|---|---|---|
| A | 52912 | 3282 | 6.202752% |
| B | 52912 | 766 | 1.447687% |
| C | 52912 | 1137 | 2.148851% |
| D | 52913 | 3986 | 7.533120% |
Noise dominated data is calculated using 1-second bins in cleaned event files. If a bin has >2000 counts, and if more than 50% of those come from <1% of pixels, then it is considered to be noise-dominated and hence unusable.
| Quadrant | # 1 sec bins | Bins with >0 counts | Bins with >2000 counts | High rate bins dominated by noise | Noise dominated (total time) | Noise dominated (detector-on time) | Marked lightcurve |
|---|---|---|---|---|---|---|---|
| A | 61397 | 52886 | 0 | 0 | 0.00% | 0.00% |  |
| B | 61397 | 52911 | 0 | 0 | 0.00% | 0.00% |  |
| C | 61397 | 52872 | 0 | 0 | 0.00% | 0.00% |  |
| D | 61398 | 52887 | 0 | 0 | 0.00% | 0.00% | 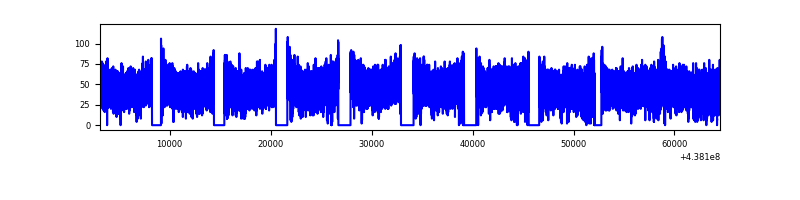 |
Top three noisy pixels from each quadrant. If the there are fewer than three noisy pixels in the level2.evt file, extra rows are filled as -1
| Pixel properties | Quadrant properties | ||||||
|---|---|---|---|---|---|---|---|
| Quadrant | DetID | PixID | Counts | Sigma | Mean | Median | Sigma |
| A | 7 | 110 | 2360 | 9.16 | 724 | 676 | 183.8 |
| A | 0 | 29 | 2243 | 8.52 | 724 | 676 | 183.8 |
| A | 0 | 30 | 2082 | 7.65 | 724 | 676 | 183.8 |
| B | 2 | 9 | 2546 | 12.75 | 732 | 696 | 145.1 |
| B | 2 | 8 | 2013 | 9.08 | 732 | 696 | 145.1 |
| B | 5 | 232 | 2000 | 8.99 | 732 | 696 | 145.1 |
| C | 3 | 203 | 2223 | 7.84 | 750 | 698 | 194.4 |
| C | 3 | 202 | 2205 | 7.75 | 750 | 698 | 194.4 |
| C | 1 | 81 | 2182 | 7.63 | 750 | 698 | 194.4 |
| D | 10 | 189 | 1820 | 6.39 | 673 | 610 | 189.2 |
| D | 6 | 79 | 1741 | 5.98 | 673 | 610 | 189.2 |
| D | 3 | 14 | 1704 | 5.78 | 673 | 610 | 189.2 |
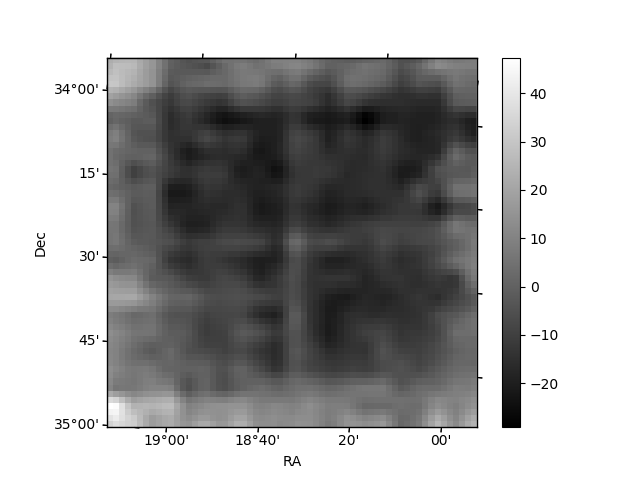
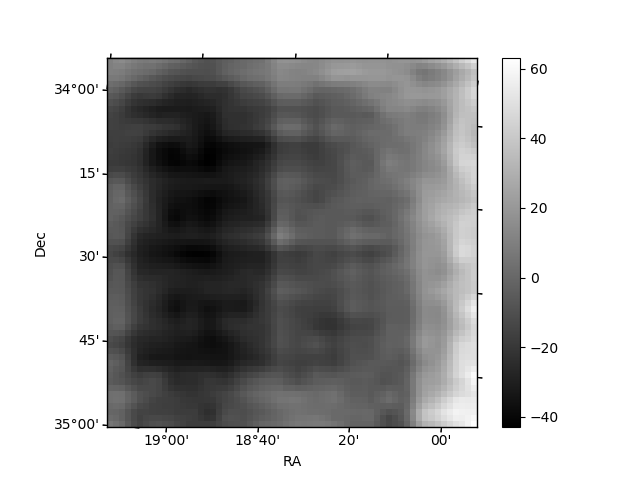
Histogram calculated using DETX and DETY for each event in the final _common_clean file
| Quadrant A |  |
 |
Quadrant B |
|---|---|---|---|
| Quadrant D |  |
 |
Quadrant C |
| Plot type | Count rate plots | Images |
|---|---|---|
| Comparison with Poisson distribution Blue bars denote a histogram of data divided into 1 sec bins. Red curve is a Poisson curve with rate = median count rate of data. |
 |
 |
| Quadrant-wise count rates Data is divided into 100 sec bins |
 |
|
| Module-wise count rates for Quadrant A Data is divided into 100 sec bins |
 |
 |
| Module-wise count rates for Quadrant B Data is divided into 100 sec bins |
 |
 |
| Module-wise count rates for Quadrant C Data is divided into 100 sec bins |
 |
 |
| Module-wise count rates for Quadrant D Data is divided into 100 sec bins |
 |
 |
| Parameter | Plot |
|---|---|
| CZT HV Monitor |  |
| D_VDD |  |
| Temperature 1 |  |
| Veto HV Monitor |  |
| Veto LLD |  |
| Alpha Counter |  |
| _CPM_Rate |  |
| CZT Counter |  |
| +2.5 Volts monitor |  |
| +5 Volts monitor |  |
| _ROLL_ROT |  |
| _Roll_DEC |  |
| _Roll_RA |  |
| Veto Counter |  |