| Param | Original file | Final file |
|---|---|---|
| Filename | modeM0/AS1A13_034T05_9000005928cztM0_level2.fits | modeM0/AS1A13_034T05_9000005928cztM0_level2_quad_clean.evt |
| Size (bytes) | 177,442,560 | 161,472,960 |
| Size | 169.2 MB | 154.0 MB |
| Events in quadrant A | 1,036,556 | 910,420 |
| Events in quadrant B | 1,019,792 | 925,550 |
| Events in quadrant C | 1,049,408 | 879,246 |
| Events in quadrant D | 883,298 | 790,394 |
| Mode M9 | |||
|---|---|---|---|
| Quadrant | BADHDUFLAG | Total packets | Discarded packets |
| A | 0 | 21 | 0 |
| B | 0 | 21 | 0 |
| C | 0 | 21 | 0 |
| D | 0 | 21 | 0 |
| Mode M0 | |||
|---|---|---|---|
| Quadrant | BADHDUFLAG | Total packets | Discarded packets |
| A | 0 | 54208 | 0 |
| B | 0 | 42482 | 0 |
| C | 0 | 45585 | 0 |
| D | 0 | 53646 | 0 |
| Mode SS | |||
|---|---|---|---|
| Quadrant | BADHDUFLAG | Total packets | Discarded packets |
| A | 0 | 412 | 0 |
| B | 0 | 412 | 0 |
| C | 0 | 412 | 0 |
| D | 0 | 412 | 0 |
| Quadrant | Total seconds | Saturated seconds | Saturation percentage |
|---|---|---|---|
| A | 20084 | 846 | 4.212308% |
| B | 20084 | 473 | 2.355109% |
| C | 20084 | 365 | 1.817367% |
| D | 20084 | 1243 | 6.189006% |
Noise dominated data is calculated using 1-second bins in cleaned event files. If a bin has >2000 counts, and if more than 50% of those come from <1% of pixels, then it is considered to be noise-dominated and hence unusable.
| Quadrant | # 1 sec bins | Bins with >0 counts | Bins with >2000 counts | High rate bins dominated by noise | Noise dominated (total time) | Noise dominated (detector-on time) | Marked lightcurve |
|---|---|---|---|---|---|---|---|
| A | 22284 | 20082 | 0 | 0 | 0.00% | 0.00% |  |
| B | 22284 | 20084 | 0 | 0 | 0.00% | 0.00% |  |
| C | 22284 | 20084 | 0 | 0 | 0.00% | 0.00% |  |
| D | 22284 | 20077 | 0 | 0 | 0.00% | 0.00% |  |
Top three noisy pixels from each quadrant. If the there are fewer than three noisy pixels in the level2.evt file, extra rows are filled as -1
| Pixel properties | Quadrant properties | ||||||
|---|---|---|---|---|---|---|---|
| Quadrant | DetID | PixID | Counts | Sigma | Mean | Median | Sigma |
| A | 7 | 110 | 884 | 8.85 | 270 | 252 | 71.4 |
| A | 0 | 29 | 817 | 7.91 | 270 | 252 | 71.4 |
| A | 15 | 236 | 816 | 7.9 | 270 | 252 | 71.4 |
| B | 2 | 9 | 949 | 12.12 | 269 | 254 | 57.4 |
| B | 3 | 17 | 744 | 8.54 | 269 | 254 | 57.4 |
| B | 2 | 8 | 737 | 8.42 | 269 | 254 | 57.4 |
| C | 1 | 81 | 818 | 7.57 | 276 | 256 | 74.2 |
| C | 3 | 203 | 815 | 7.53 | 276 | 256 | 74.2 |
| C | 3 | 202 | 810 | 7.46 | 276 | 256 | 74.2 |
| D | 10 | 189 | 653 | 5.97 | 252 | 228 | 71.2 |
| D | 3 | 159 | 642 | 5.81 | 252 | 228 | 71.2 |
| D | 4 | 63 | 632 | 5.67 | 252 | 228 | 71.2 |
Histogram calculated using DETX and DETY for each event in the final _common_clean file
| Quadrant A |  |
 |
Quadrant B |
|---|---|---|---|
| Quadrant D |  |
 |
Quadrant C |
| Plot type | Count rate plots | Images |
|---|---|---|
| Comparison with Poisson distribution Blue bars denote a histogram of data divided into 1 sec bins. Red curve is a Poisson curve with rate = median count rate of data. |
 |
 |
| Quadrant-wise count rates Data is divided into 100 sec bins |
 |
|
| Module-wise count rates for Quadrant A Data is divided into 100 sec bins |
 |
 |
| Module-wise count rates for Quadrant B Data is divided into 100 sec bins |
 |
 |
| Module-wise count rates for Quadrant C Data is divided into 100 sec bins |
 |
 |
| Module-wise count rates for Quadrant D Data is divided into 100 sec bins |
 |
 |
| Parameter | Plot |
|---|---|
| CZT HV Monitor |  |
| D_VDD |  |
| Temperature 1 |  |
| Veto HV Monitor |  |
| Veto LLD |  |
| Alpha Counter |  |
| _CPM_Rate |  |
| CZT Counter |  |
| +2.5 Volts monitor | 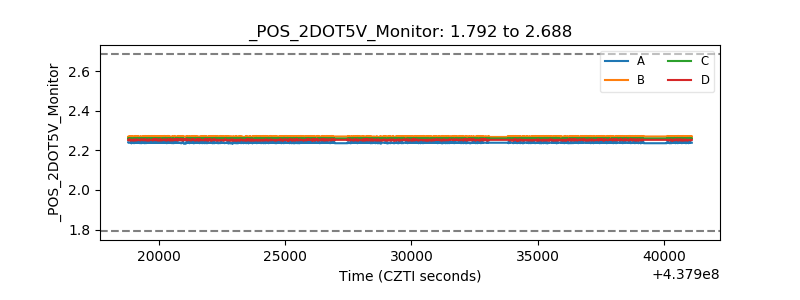 |
| +5 Volts monitor |  |
| _ROLL_ROT |  |
| _Roll_DEC |  |
| _Roll_RA |  |
| Veto Counter |  |