| Param | Original file | Final file |
|---|---|---|
| Filename | modeM0/AS1A13_065T06_9000005924cztM0_level2.fits | modeM0/AS1A13_065T06_9000005924cztM0_level2_quad_clean.evt |
| Size (bytes) | 1,307,016,000 | 1,341,213,120 |
| Size | 1.2 GB | 1.2 GB |
| Events in quadrant A | 5,636,180 | 5,572,692 |
| Events in quadrant B | 7,967,134 | 8,707,846 |
| Events in quadrant C | 8,352,906 | 8,300,929 |
| Events in quadrant D | 6,904,876 | 7,353,084 |
| Mode SS | |||
|---|---|---|---|
| Quadrant | BADHDUFLAG | Total packets | Discarded packets |
| A | 0 | 3203 | 0 |
| B | 0 | 3164 | 0 |
| C | 0 | 3210 | 0 |
| D | 0 | 3208 | 0 |
| Mode M9 | |||
|---|---|---|---|
| Quadrant | BADHDUFLAG | Total packets | Discarded packets |
| A | 0 | 223 | 0 |
| B | 0 | 223 | 0 |
| C | 0 | 223 | 0 |
| D | 0 | 223 | 0 |
| Mode M0 | |||
|---|---|---|---|
| Quadrant | BADHDUFLAG | Total packets | Discarded packets |
| A | 0 | 759129 | 0 |
| B | 0 | 367800 | 0 |
| C | 0 | 335660 | 0 |
| D | 0 | 439491 | 0 |
| Quadrant | Total seconds | Saturated seconds | Saturation percentage |
|---|---|---|---|
| A | 155854 | 64220 | 41.205231% |
| B | 155952 | 7204 | 4.619370% |
| C | 155838 | 1974 | 1.266700% |
| D | 155758 | 9144 | 5.870645% |
Noise dominated data is calculated using 1-second bins in cleaned event files. If a bin has >2000 counts, and if more than 50% of those come from <1% of pixels, then it is considered to be noise-dominated and hence unusable.
| Quadrant | # 1 sec bins | Bins with >0 counts | Bins with >2000 counts | High rate bins dominated by noise | Noise dominated (total time) | Noise dominated (detector-on time) | Marked lightcurve |
|---|---|---|---|---|---|---|---|
| A | 192826 | 136277 | 0 | 0 | 0.00% | 0.00% |  |
| B | 192826 | 156015 | 0 | 0 | 0.00% | 0.00% |  |
| C | 192825 | 155996 | 0 | 0 | 0.00% | 0.00% |  |
| D | 192825 | 155781 | 0 | 0 | 0.00% | 0.00% |  |
Top three noisy pixels from each quadrant. If the there are fewer than three noisy pixels in the level2.evt file, extra rows are filled as -1
| Pixel properties | Quadrant properties | ||||||
|---|---|---|---|---|---|---|---|
| Quadrant | DetID | PixID | Counts | Sigma | Mean | Median | Sigma |
| A | 7 | 110 | 4674 | 8.88 | 1472 | 1371 | 371.9 |
| A | 0 | 29 | 4669 | 8.87 | 1472 | 1371 | 371.9 |
| A | 15 | 236 | 4343 | 7.99 | 1472 | 1371 | 371.9 |
| B | 2 | 9 | 7272 | 12.68 | 2107 | 1998 | 415.8 |
| B | 3 | 17 | 5939 | 9.48 | 2107 | 1998 | 415.8 |
| B | 2 | 8 | 5747 | 9.02 | 2107 | 1998 | 415.8 |
| C | 1 | 81 | 6575 | 7.93 | 2213 | 2056 | 569.9 |
| C | 3 | 202 | 6466 | 7.74 | 2213 | 2056 | 569.9 |
| C | 1 | 80 | 6450 | 7.71 | 2213 | 2056 | 569.9 |
| D | 10 | 189 | 5067 | 5.84 | 1997 | 1812 | 557.3 |
| D | 3 | 14 | 5056 | 5.82 | 1997 | 1812 | 557.3 |
| D | 7 | 3 | 5054 | 5.82 | 1997 | 1812 | 557.3 |
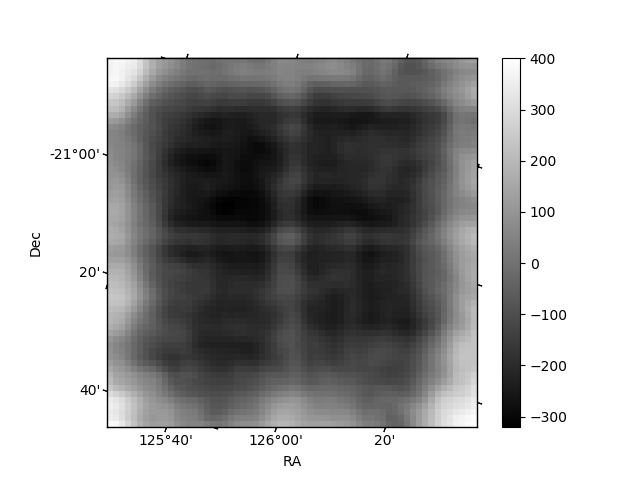
Histogram calculated using DETX and DETY for each event in the final _common_clean file
| Quadrant A |  |
 |
Quadrant B |
|---|---|---|---|
| Quadrant D |  |
 |
Quadrant C |
| Plot type | Count rate plots | Images |
|---|---|---|
| Comparison with Poisson distribution Blue bars denote a histogram of data divided into 1 sec bins. Red curve is a Poisson curve with rate = median count rate of data. |
 |
 |
| Quadrant-wise count rates Data is divided into 100 sec bins |
 |
|
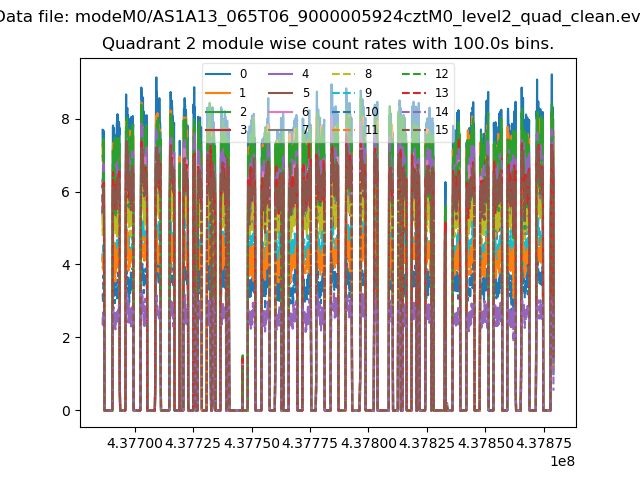
| Module-wise count rates for Quadrant A Data is divided into 100 sec bins |
 |
 |
| Module-wise count rates for Quadrant B Data is divided into 100 sec bins |
 |
 |
| Module-wise count rates for Quadrant C Data is divided into 100 sec bins |
 |
 |
| Module-wise count rates for Quadrant D Data is divided into 100 sec bins |
 |
 |
| Parameter | Plot |
|---|---|
| CZT HV Monitor |  |
| D_VDD | 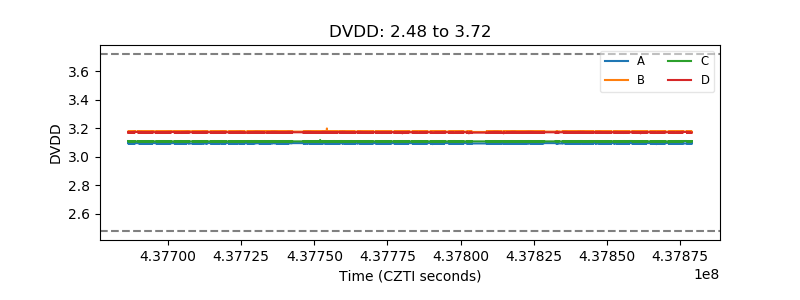 |
| Temperature 1 |  |
| Veto HV Monitor |  |
| Veto LLD |  |
| Alpha Counter | 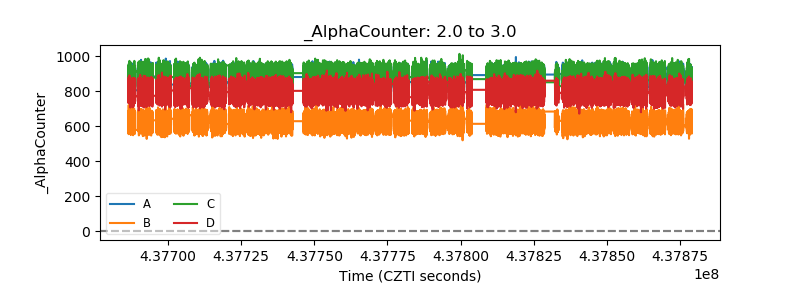 |
| _CPM_Rate | 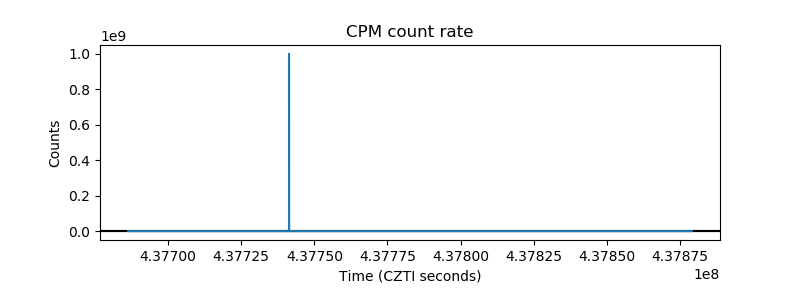 |
| CZT Counter |  |
| +2.5 Volts monitor |  |
| +5 Volts monitor |  |
| _ROLL_ROT |  |
| _Roll_DEC |  |
| _Roll_RA | 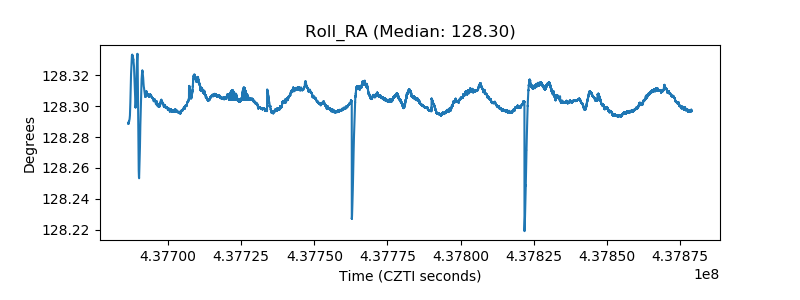 |
| Veto Counter | 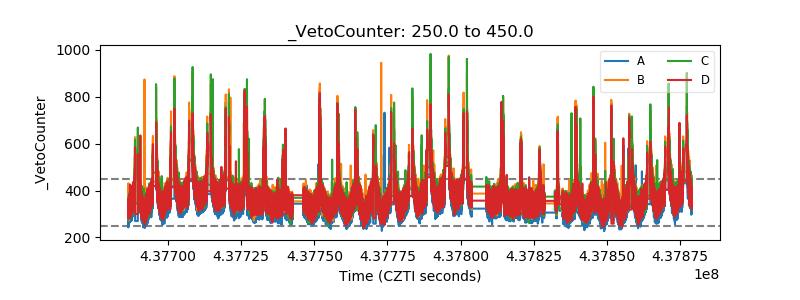 |